Register

What is Managed Thanos?

Thanos is a cloud-native, CNCF Incubating project that extends Prometheus with long-term time-series storage, global query federation, and high availability. It solves the core limitations of standalone Prometheus: limited retention, single-instance queries, and lack of built-in redundancy.
With Managed Thanos on Exoscale, provisioning, updates, backups, and scaling are fully automated. Connect your Prometheus instances via remote write and start querying metrics across your entire infrastructure from a single endpoint, without managing Thanos components yourself.

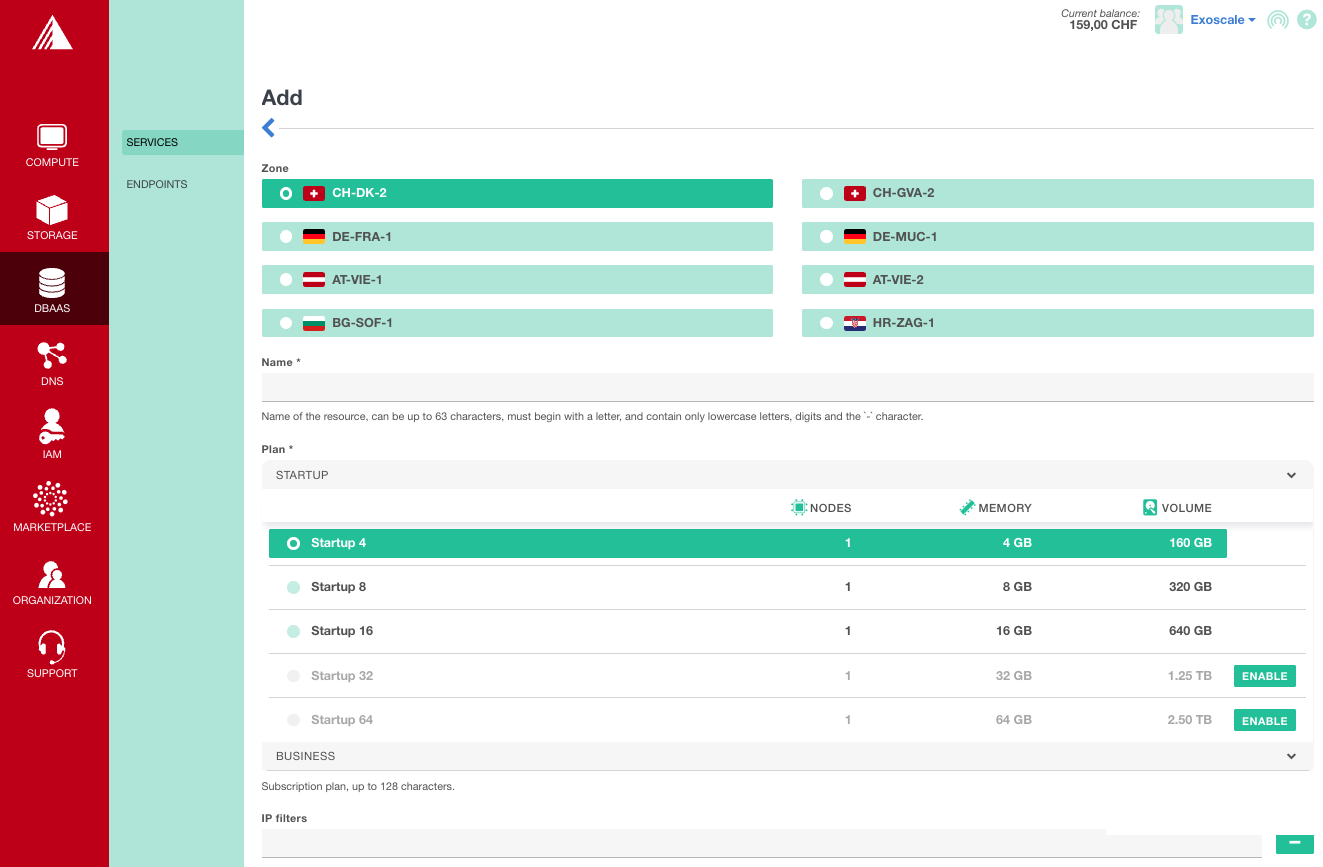
Managed Thanos available on the Exoscale Portal

Exoscale

Why choose Exoscale Managed Thanos

Unlimited metrics retention

Unlimited metrics retention

Store Prometheus metrics beyond the default retention window. Managed Thanos provides configurable long-term storage with automatic downsampling: 5-minute resolution after 40 hours, 1-hour resolution after 10 days.

Global query federation

Global query federation

Query metrics across multiple Prometheus instances and multi-cluster environments from a single endpoint. Get a unified view of your entire infrastructure monitoring without managing complex federation setups.

Prometheus and PromQL compatible

Prometheus and PromQL compatible

Thanos is fully compatible with Prometheus and supports native PromQL queries. Connect your existing Prometheus instances via remote write with no changes to your existing queries or alerting rules.

High availability

High availability

Business plans provide 3-node clusters with automatic failover. Startup plans are backed by a 99.95% SLA, Business plans by a 99.99% SLA, ensuring your monitoring data remains accessible.

Automatic downsampling and compaction

Automatic downsampling and compaction

Older metrics are automatically downsampled and compacted in object storage to optimize query performance, reducing costs while preserving long-term trend visibility.

The Prometheus Monitoring Stack

Managed Thanos is the backbone of a complete Prometheus monitoring architecture. Connect your Prometheus instances, store metrics long-term, and visualize everything with Grafana.

Connect Prometheus to Thanos

Managed Thanos ingests metrics from your Prometheus instances using the remote write protocol. Configure your existing Prometheus deployments to send data to your Thanos endpoint and start aggregating metrics from multiple sources in minutes.
Connect Prometheus to Managed Thanos

Visualize with Grafana

Connect Managed Grafana to your Thanos instance to create interactive dashboards and alerts. Use standard PromQL queries to visualize both real-time and historical metrics across your entire infrastructure from a single pane of glass.
Integrate Grafana with Thanos

From metrics collection to long-term analysis

Build a complete monitoring stack: Prometheus collects metrics from your applications and infrastructure, remote-writes them to Managed Thanos for long-term storage, and Grafana provides visualization and alerting. This architecture scales from a single Prometheus instance to dozens, with Thanos handling deduplication, compaction, and downsampling automatically.

Managed Thanos plans

Startup

Startup plans run on a single node and are suited for development, testing, and smaller production workloads. All Startup plans include daily backups, automated maintenance, and a 99.95% SLA. Choose from configurations ranging from 4 GB to 64 GB RAM, with local storage from 160 GB to 2,560 GB depending on your metrics retention needs.

Memory CPU Volume size Nodes Price / Hour ({{ currency | uppercase }})
Startup-4 4 GB 2 160 GB 1 {{ prices['dbaas-thanos']['startup-4'][currency] | number:8 }}
Startup-8 8 GB 4 320 GB 1 {{ prices['dbaas-thanos']['startup-8'][currency] | number:8 }}
Startup-16 16 GB 4 640 GB 1 {{ prices['dbaas-thanos']['startup-16'][currency] | number:8 }}
Startup-32 32 GB 8 1280 GB 1 {{ prices['dbaas-thanos']['startup-32'][currency] | number:8 }}
Startup-64 64 GB 12 2560 GB 1 {{ prices['dbaas-thanos']['startup-64'][currency] | number:8 }}
  1. [1]

    Available in all Zones

Transparent pricing for your monitoring stack

Exoscale offers pay-as-you-go pricing for Managed Thanos. All plans are billed per second with no upfront commitment, allowing you to scale cloud monitoring with confidence and full cost transparency. Choose between Startup and Business plans based on your availability and performance requirements.
Pricing calculator

Managed Thanos features

Explore all features View the full Managed Thanos documentation

Integrate Thanos with your Exoscale stack

Managed Thanos fits naturally into your Exoscale environment. Connect it to any service you already run, aggregate time-series data from multi-cluster deployments, and visualize everything with Grafana. One cloud-native stack for your entire infrastructure monitoring, fully managed so DevOps and SRE teams never have to worry about the underlying complexity.

Trusted across Europe: Reliable monitoring with Managed Thanos

Managed Thanos improves metrics visibility across infrastructure with minimal operational overhead. The Exoscale support team can provide guidance on how the service fits into specific architectures, answer technical questions, and assist with evaluating integration scenarios.

Contact us

Managed Thanos powered by aiven.io

Our Managed Thanos is powered by Aiven, one of the leading European companies for managing open source data infrastructure in the cloud. The partnership offers Exoscale customers an integrated environment for their complete cloud infrastructure without any security compromise. Both companies are GDPR-compliant to ensure the highest standards for customers’ data. The sole use of open source projects ensures that customers are not vendor locked-in and always at the latest standard of technology.

Combine with...

…other Exoscale products. Build a complete observability stack with Grafana, run workloads on SKS, and get expert help with Support Plans.

Managed Grafana

Managed Grafana

Visualize metrics in real time with a fully managed Grafana service on Exoscale. Create interactive dashboards, configure alerts, and connect to your Managed Thanos instance for complete monitoring without self-hosting.

Discover
SKS

SKS

Deploy a production-ready Kubernetes cluster in 120 seconds. Run Prometheus on SKS nodes and send metrics to Managed Thanos for centralized, long-term monitoring of your containerized workloads.

Discover
Support Plans

Support Plans

Get expert guidance for your monitoring architecture with flexible support plans. Guaranteed response times (SLA) ensure our engineers are available when you need them most.

Discover

Helpful resources for Managed Thanos

Documentation

Access comprehensive documentation covering all aspects of Managed Thanos, including architecture, configuration, integration guides, and API references.

Quick Start

New to Managed Thanos? Follow our quick start guide to deploy your first instance, connect Prometheus, and start querying metrics in minutes.

Portal

Deploy and manage your Thanos instances through the Exoscale web interface. Create instances, configure plans, and monitor your service within a few clicks.

Explore more Exoscale services

Expand your infrastructure with services that boost availability, optimize performance, and provide expert support for all your workloads.

Managed OpenSearch

Managed OpenSearch

Centralized log management and analysis platform for real-time monitoring, troubleshooting, and security insights across your infrastructure.

Discover
DBaaS

DBaaS

Explore our full range of managed database services including PostgreSQL, MySQL, Valkey, Apache Kafka, and OpenSearch. All fully managed in Europe.

Discover
Compute Instances

Compute Instances

Run high-performance virtual machines alongside your monitoring stack. Choose from predefined instance sizes to match your workload's CPU and memory requirements.

Discover

Frequently asked questions about Managed Thanos

What is Managed Thanos?

Managed Thanos is a fully managed observability service based on the open-source Thanos project. It extends Prometheus with long-term metrics storage, global query federation, and high availability. Exoscale handles all operational aspects including provisioning, updates, backups, and scaling.

How does Thanos relate to Prometheus?

Thanos extends Prometheus by solving its core limitations. While Prometheus is designed for short-term metrics collection and alerting, Thanos adds long-term storage, the ability to query across multiple Prometheus instances, automatic downsampling, and high availability. Your Prometheus instances connect to Thanos via the remote write protocol, and you can query all metrics using standard PromQL.

What is the pricing structure for Managed Thanos?

Managed Thanos is billed per second based on the selected plan, with no upfront commitment. Startup plans (single node) and Business plans (3-node HA) are available with configurations from 4 GB to 64 GB RAM. View our pricing calculator for detailed plan information.

Can I use Managed Thanos with Grafana?

Yes. Managed Thanos integrates natively with Managed Grafana as a Prometheus-compatible data source. You can create dashboards that combine real-time and historical metrics, set up alerts, and use standard PromQL queries. Follow our integration guide to get started.

Where is the data stored?

All metrics data is stored in Exoscale’s European data centers across 8 zones in 6 countries (Switzerland, Germany, Austria, Bulgaria, France, Spain). Data never leaves the zone you select, ensuring full GDPR compliance and data sovereignty.

How does automatic downsampling work?

Managed Thanos automatically reduces the resolution of older metrics to optimize storage and query performance. Raw metrics are kept at full resolution. After 40 hours, data is downsampled to 5-minute resolution. After 10 days, data is further downsampled to 1-hour resolution. This process is fully automatic and ensures long-term trend analysis remains efficient.

Thanos vs Cortex vs Mimir: what are the differences?

Thanos, Cortex, and Grafana Mimir all extend Prometheus with long-term storage and high availability. Thanos uses a sidecar or receiver architecture with object storage, while Cortex and its successor Mimir use a centralized remote-write approach. VictoriaMetrics is another popular alternative written from scratch. With Managed Thanos on Exoscale, you get the benefits of Thanos without the operational complexity of self-hosting, no need to manage Store Gateways, Compactors, or Query Frontends yourself.

Who is Managed Thanos for?

Managed Thanos is designed for DevOps engineers, SRE teams, and platform teams who run Prometheus for infrastructure monitoring and need to scale beyond a single instance. Whether you manage a few servers or multi-cluster Kubernetes environments, Managed Thanos provides centralized, long-term time-series storage with zero operational overhead.