Managed Grafana for scalable cloud monitoring
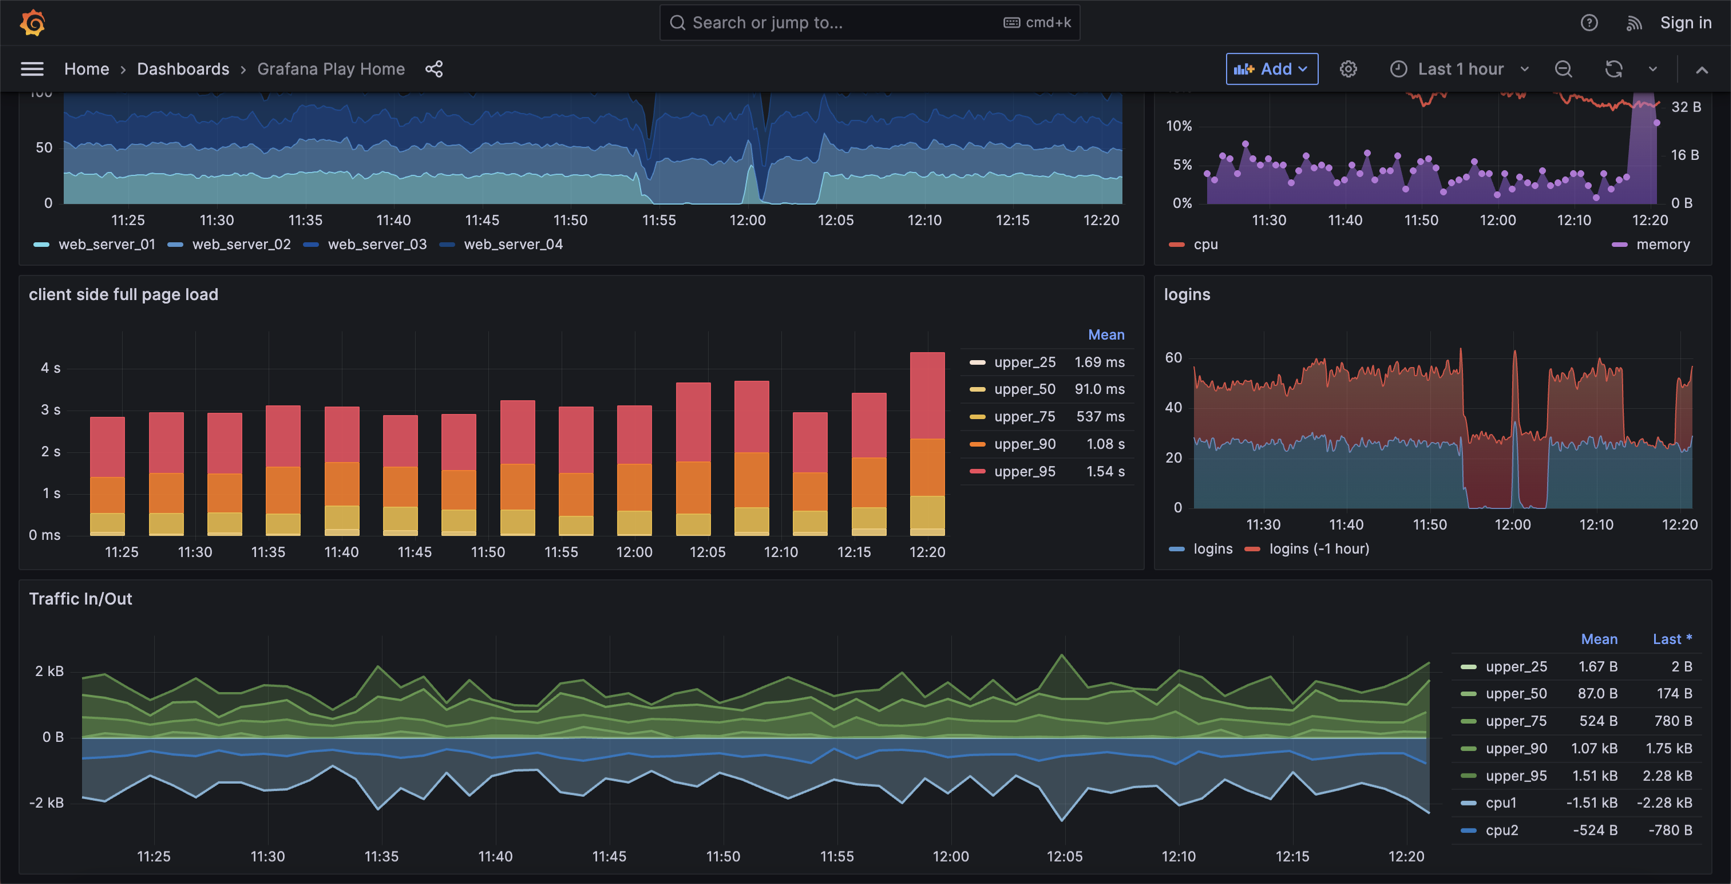
Grafana is the leading open-source platform for transforming metrics, logs, and traces into powerful dashboards. Exoscale Managed Grafana enables users to visualize metrics, logs, and traces collected from any application. The open source observability platform is the ideal solution for assembling data to inspect your stack. Data sources like Prometheus or database engines can be easily connected to Grafana. Dashboards can be easily created using these data sources and can display visualizations such as graphs, heat maps, charts, and histograms. Interact with your data, from real-time graphing of time series data to analyzing log files or leveraging insights from your SQL database. This makes monitoring simpler, troubleshooting faster, and provides real-time visibility into your cloud workloads.