Monitoring is an essential part of any application or infrastructure environment, regardless of the used technologies or decisions that a customer has made. Tools like Prometheus and Grafana are popular choices for tracking and analyzing the performance and availability of systems.
Prometheus is an open-source monitoring and alerting system that is designed to be highly scalable and flexible. It uses a pull-based model to scrape metrics from monitored systems and stores the collected data in a time-series database.
Grafana is an open-source data visualization and monitoring platform that can be used to create interactive dashboards for monitoring and analyzing time-series data. It integrates with a variety of data sources, including Prometheus, and provides a wide range of visualizations and customization options.
With some simple steps you can easily deploy Prometheus and Grafana on Exoscale using Terraform and Ansible.
Deploying Prometheus and Grafana
To deploy Prometheus and Grafana on Exoscale using Terraform and Ansible, you will need to follow these steps:
-
Download and install the latest versions of Terraform and Ansible.
-
Configure your Exoscale credentials: Set the
EXOSCALE_API_KEYandEXOSCALE_API_SECRETenvironment variables with your Exoscale API key and secret. Create your API Key in our portal. -
Create the Terraform configuration files (to define the infrastructure resources you want to create) and Ansible playbooks (to deploy and configure your monitoring stack). Find an example on GitHub.
-
Initialize Terraform: Run the
terraform initcommand to initialize the working directory. This will download the necessary plugins to interact with Exoscale. -
Deploy the monitoring stack: Run the
terraform applycommand to create the infrastructure. Terraform will automatically call the Ansible playbooks from the user data section. User data is a script or configuration data that is passed to the instance at launch and can be used to perform tasks like installing packages, configuring the instance, or running scripts.
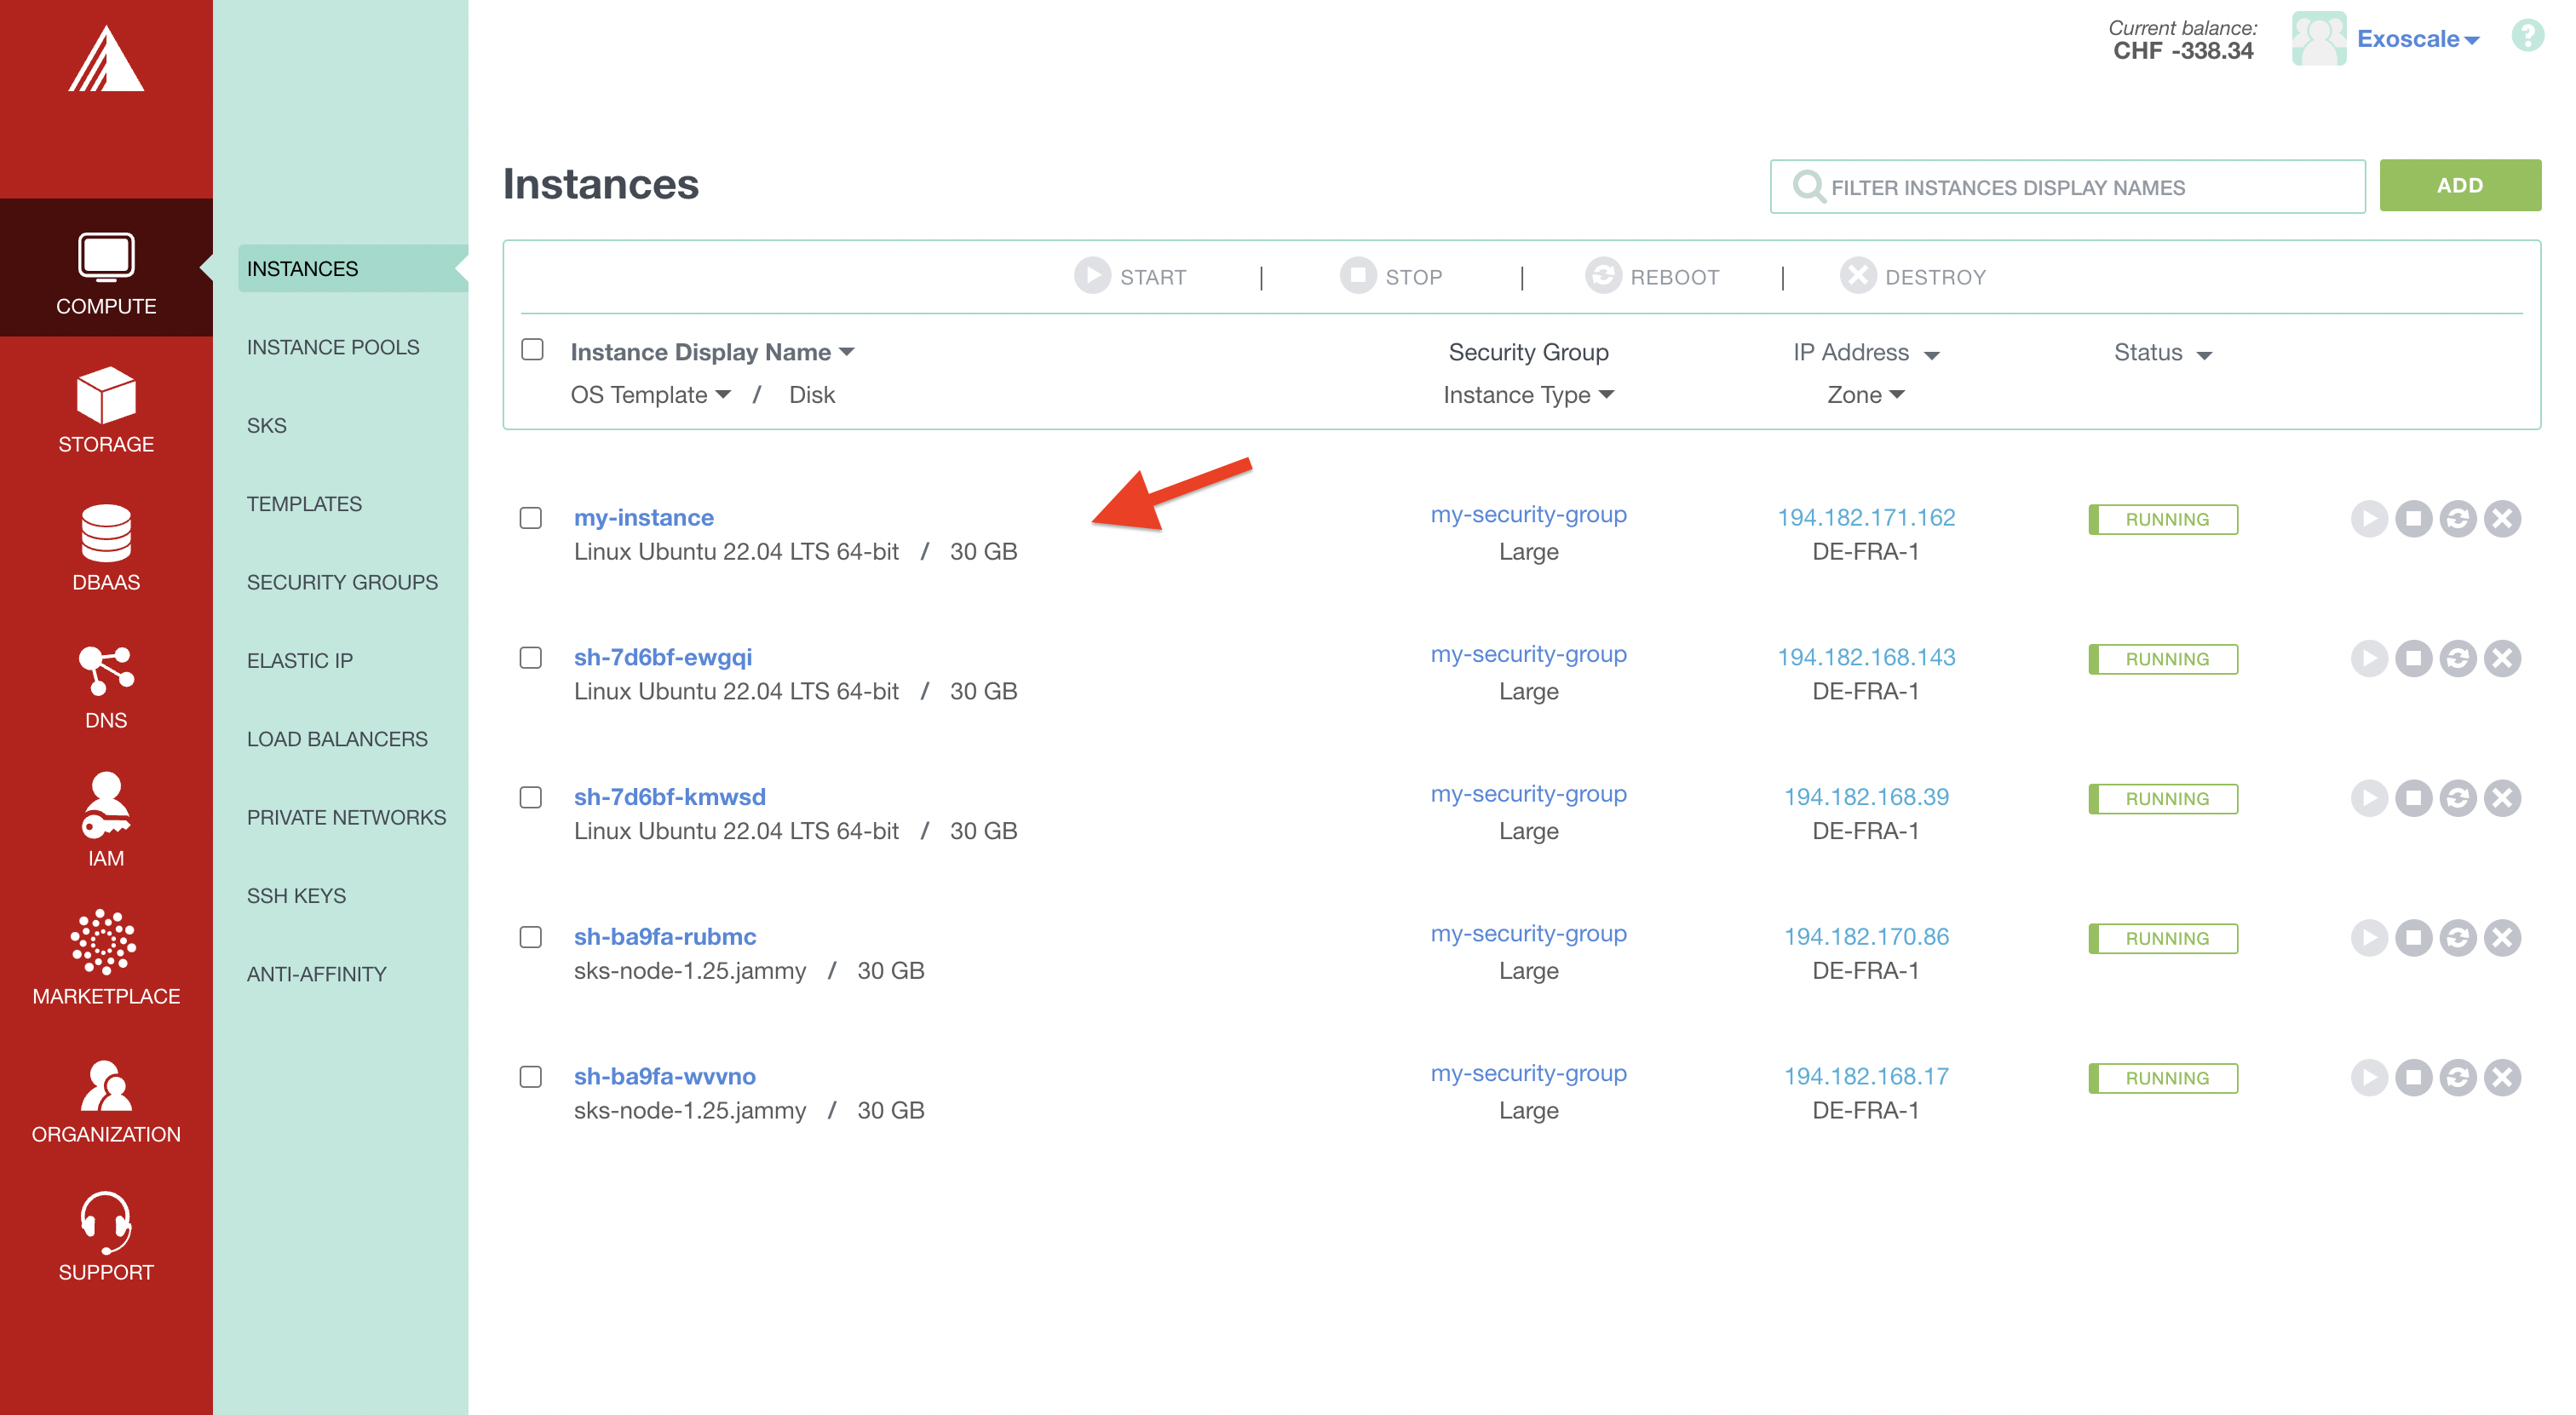
Once the apply has finished, you can use the Exoscale Portal to manage and access Prometheus and Grafana.
Automated tasks performed in the background
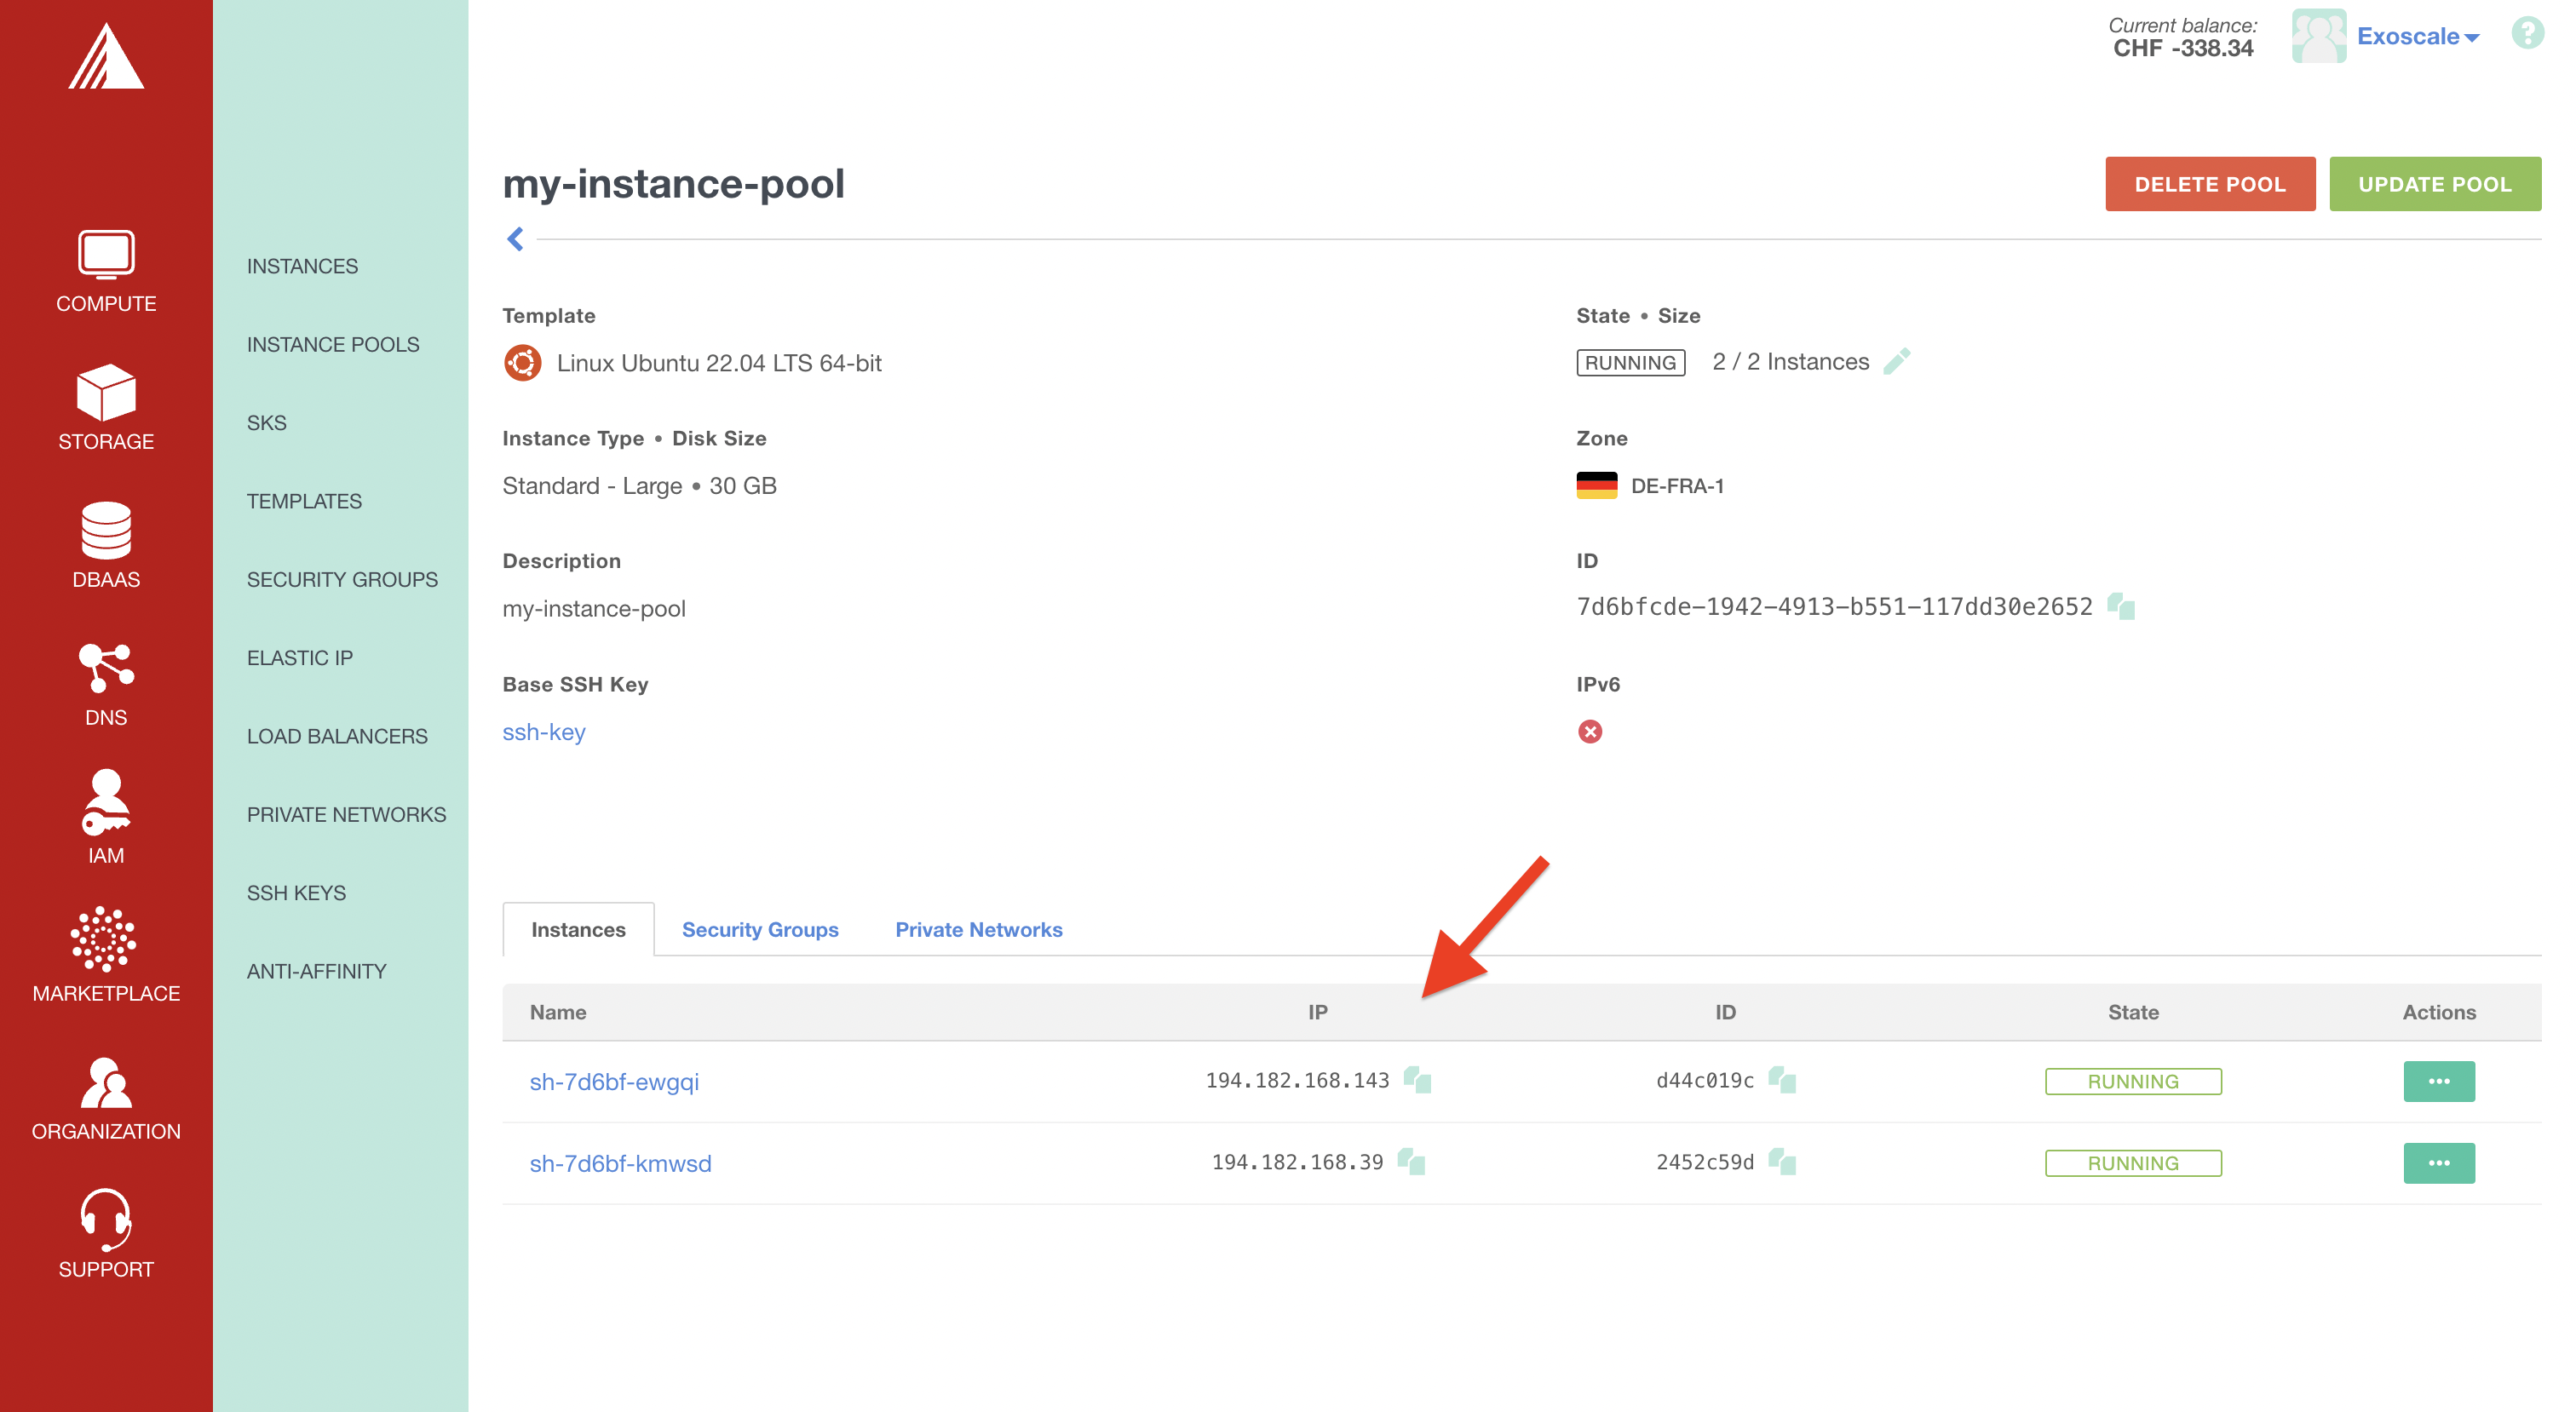
- Terraform creates all the necessary resources for the monitoring stack and the instances to monitor.

- Ansible creates a dynamic inventory listing the target instances to monitor, on which the node-exporter will be installed and configured.
Node exporter is an open source tool that allows you to export various metrics from a Linux machine to Prometheus. It provides a range of metrics about the machine’s hardware and software, including CPU, memory, network, and filesystem usage.

-
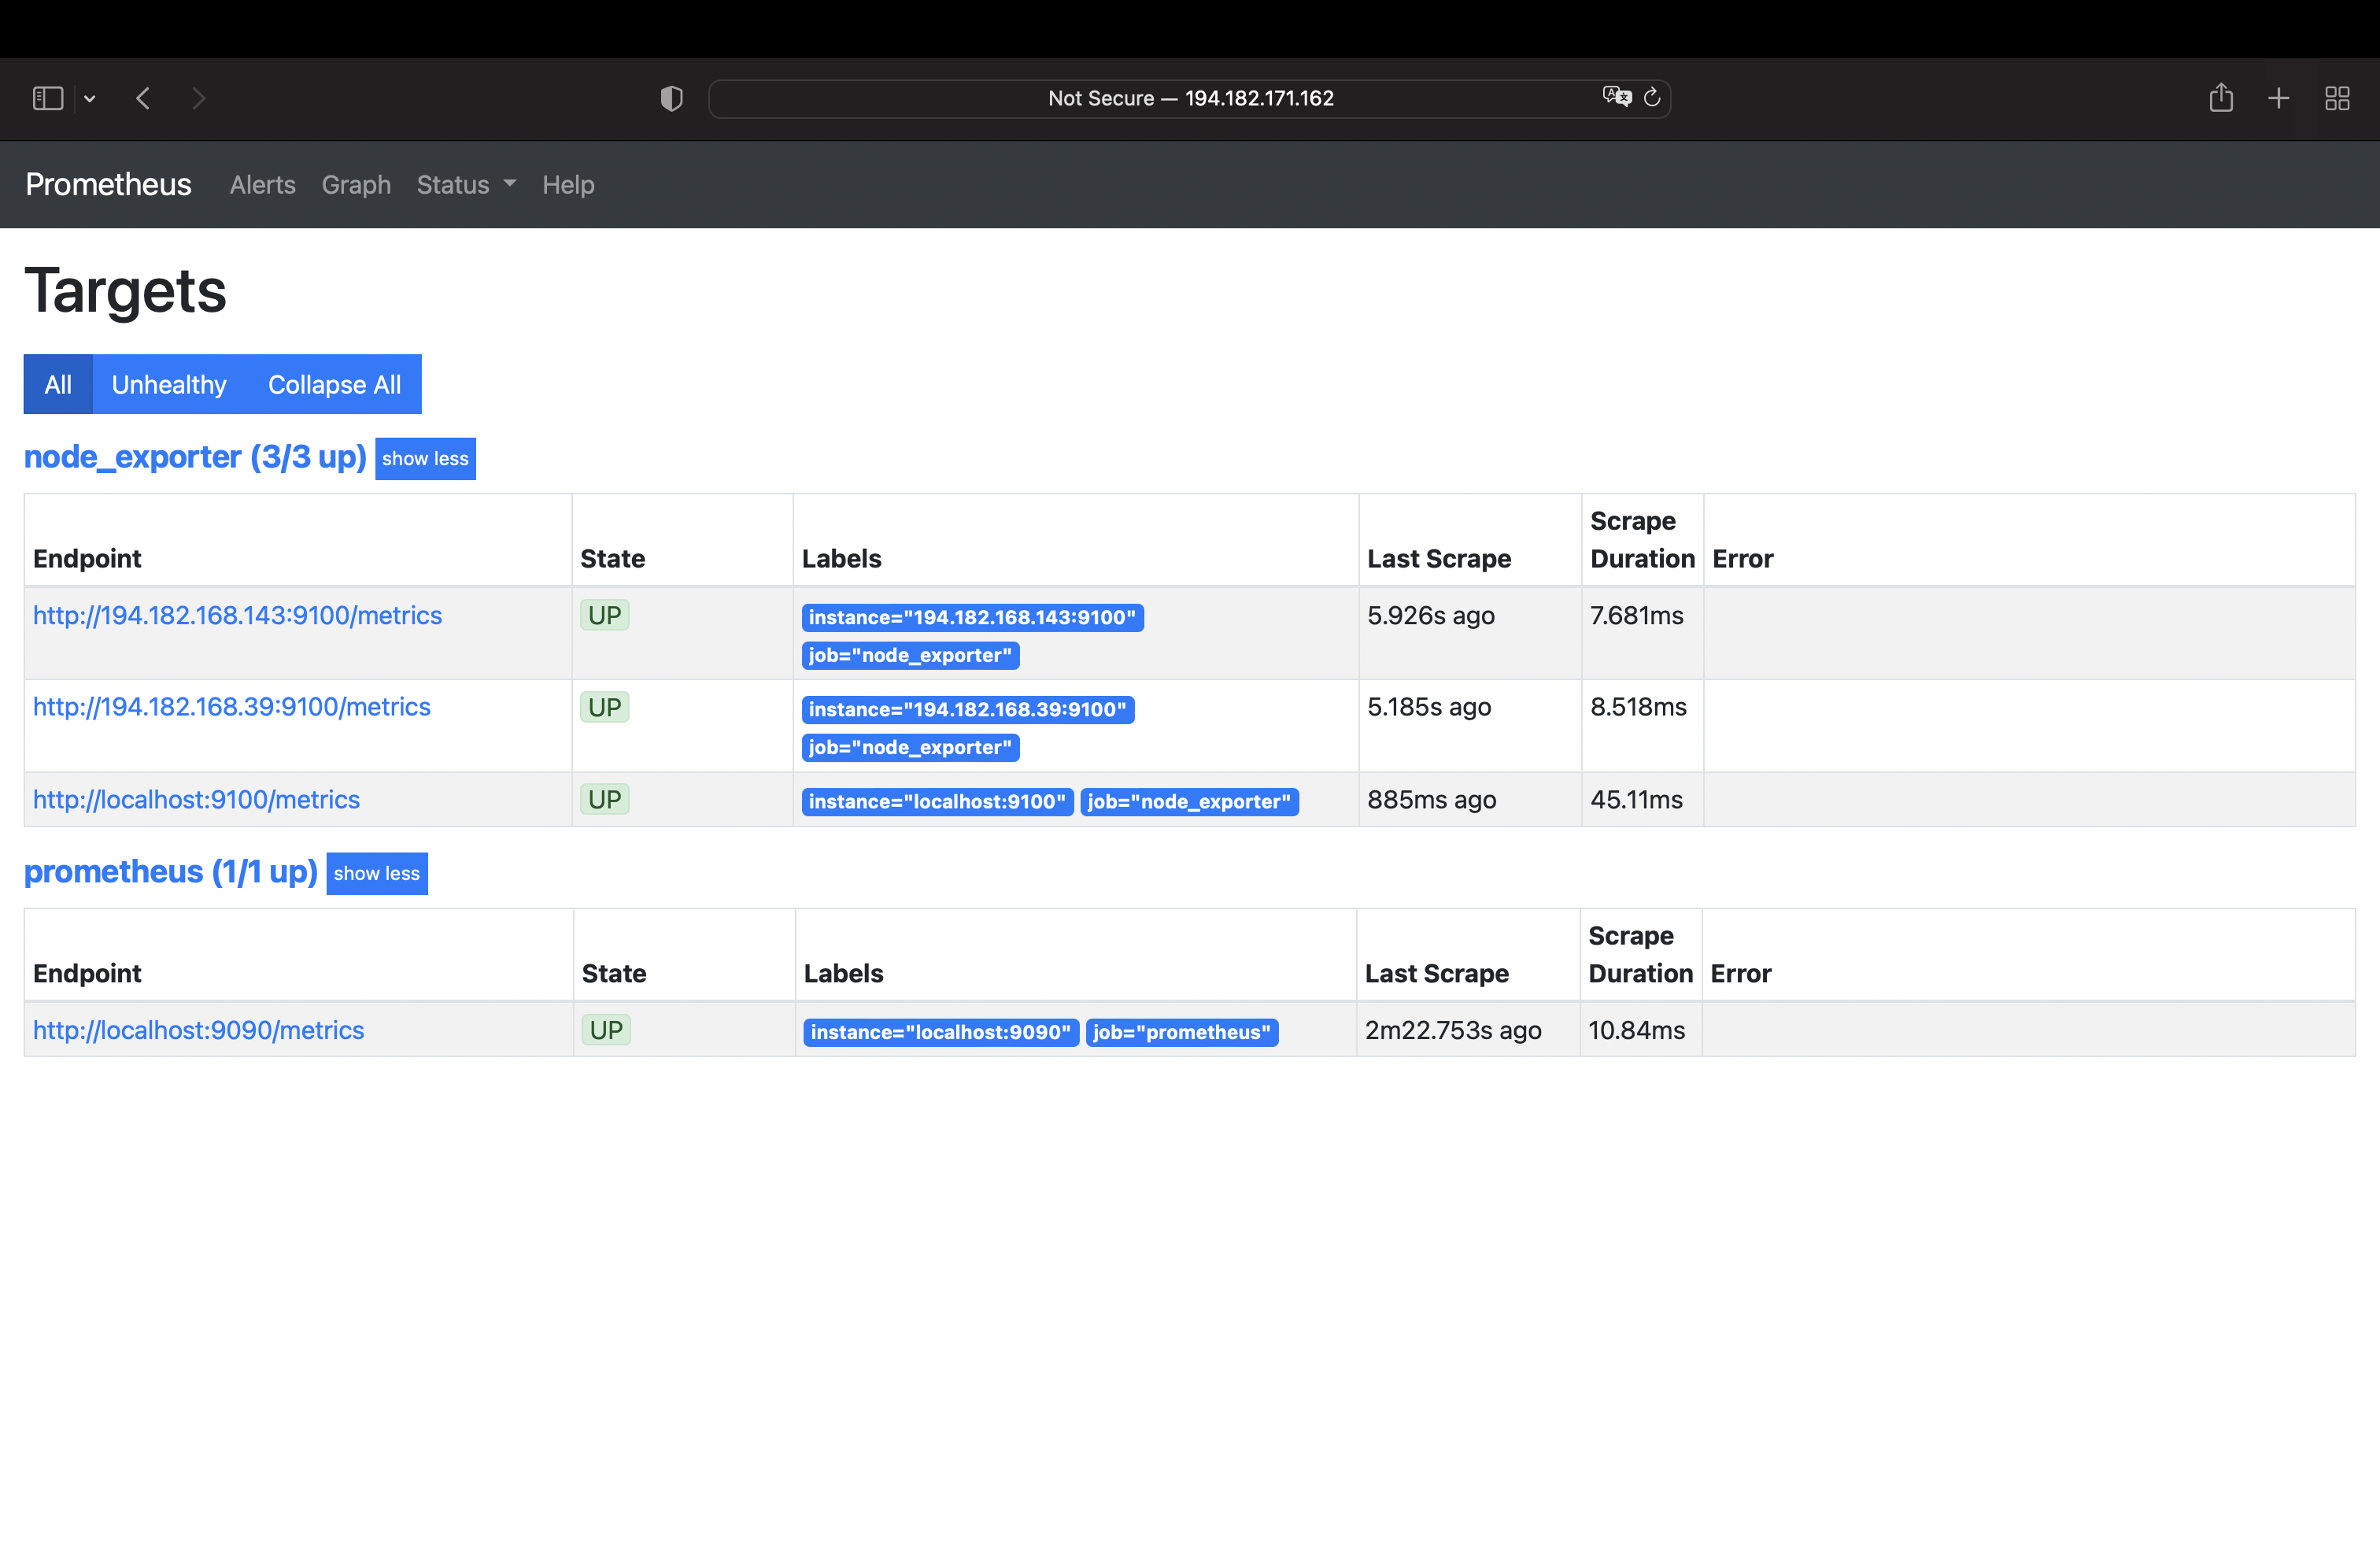
Install, configure and start the Prometheus server, accessible via the URL
http://IP-address:9090. -
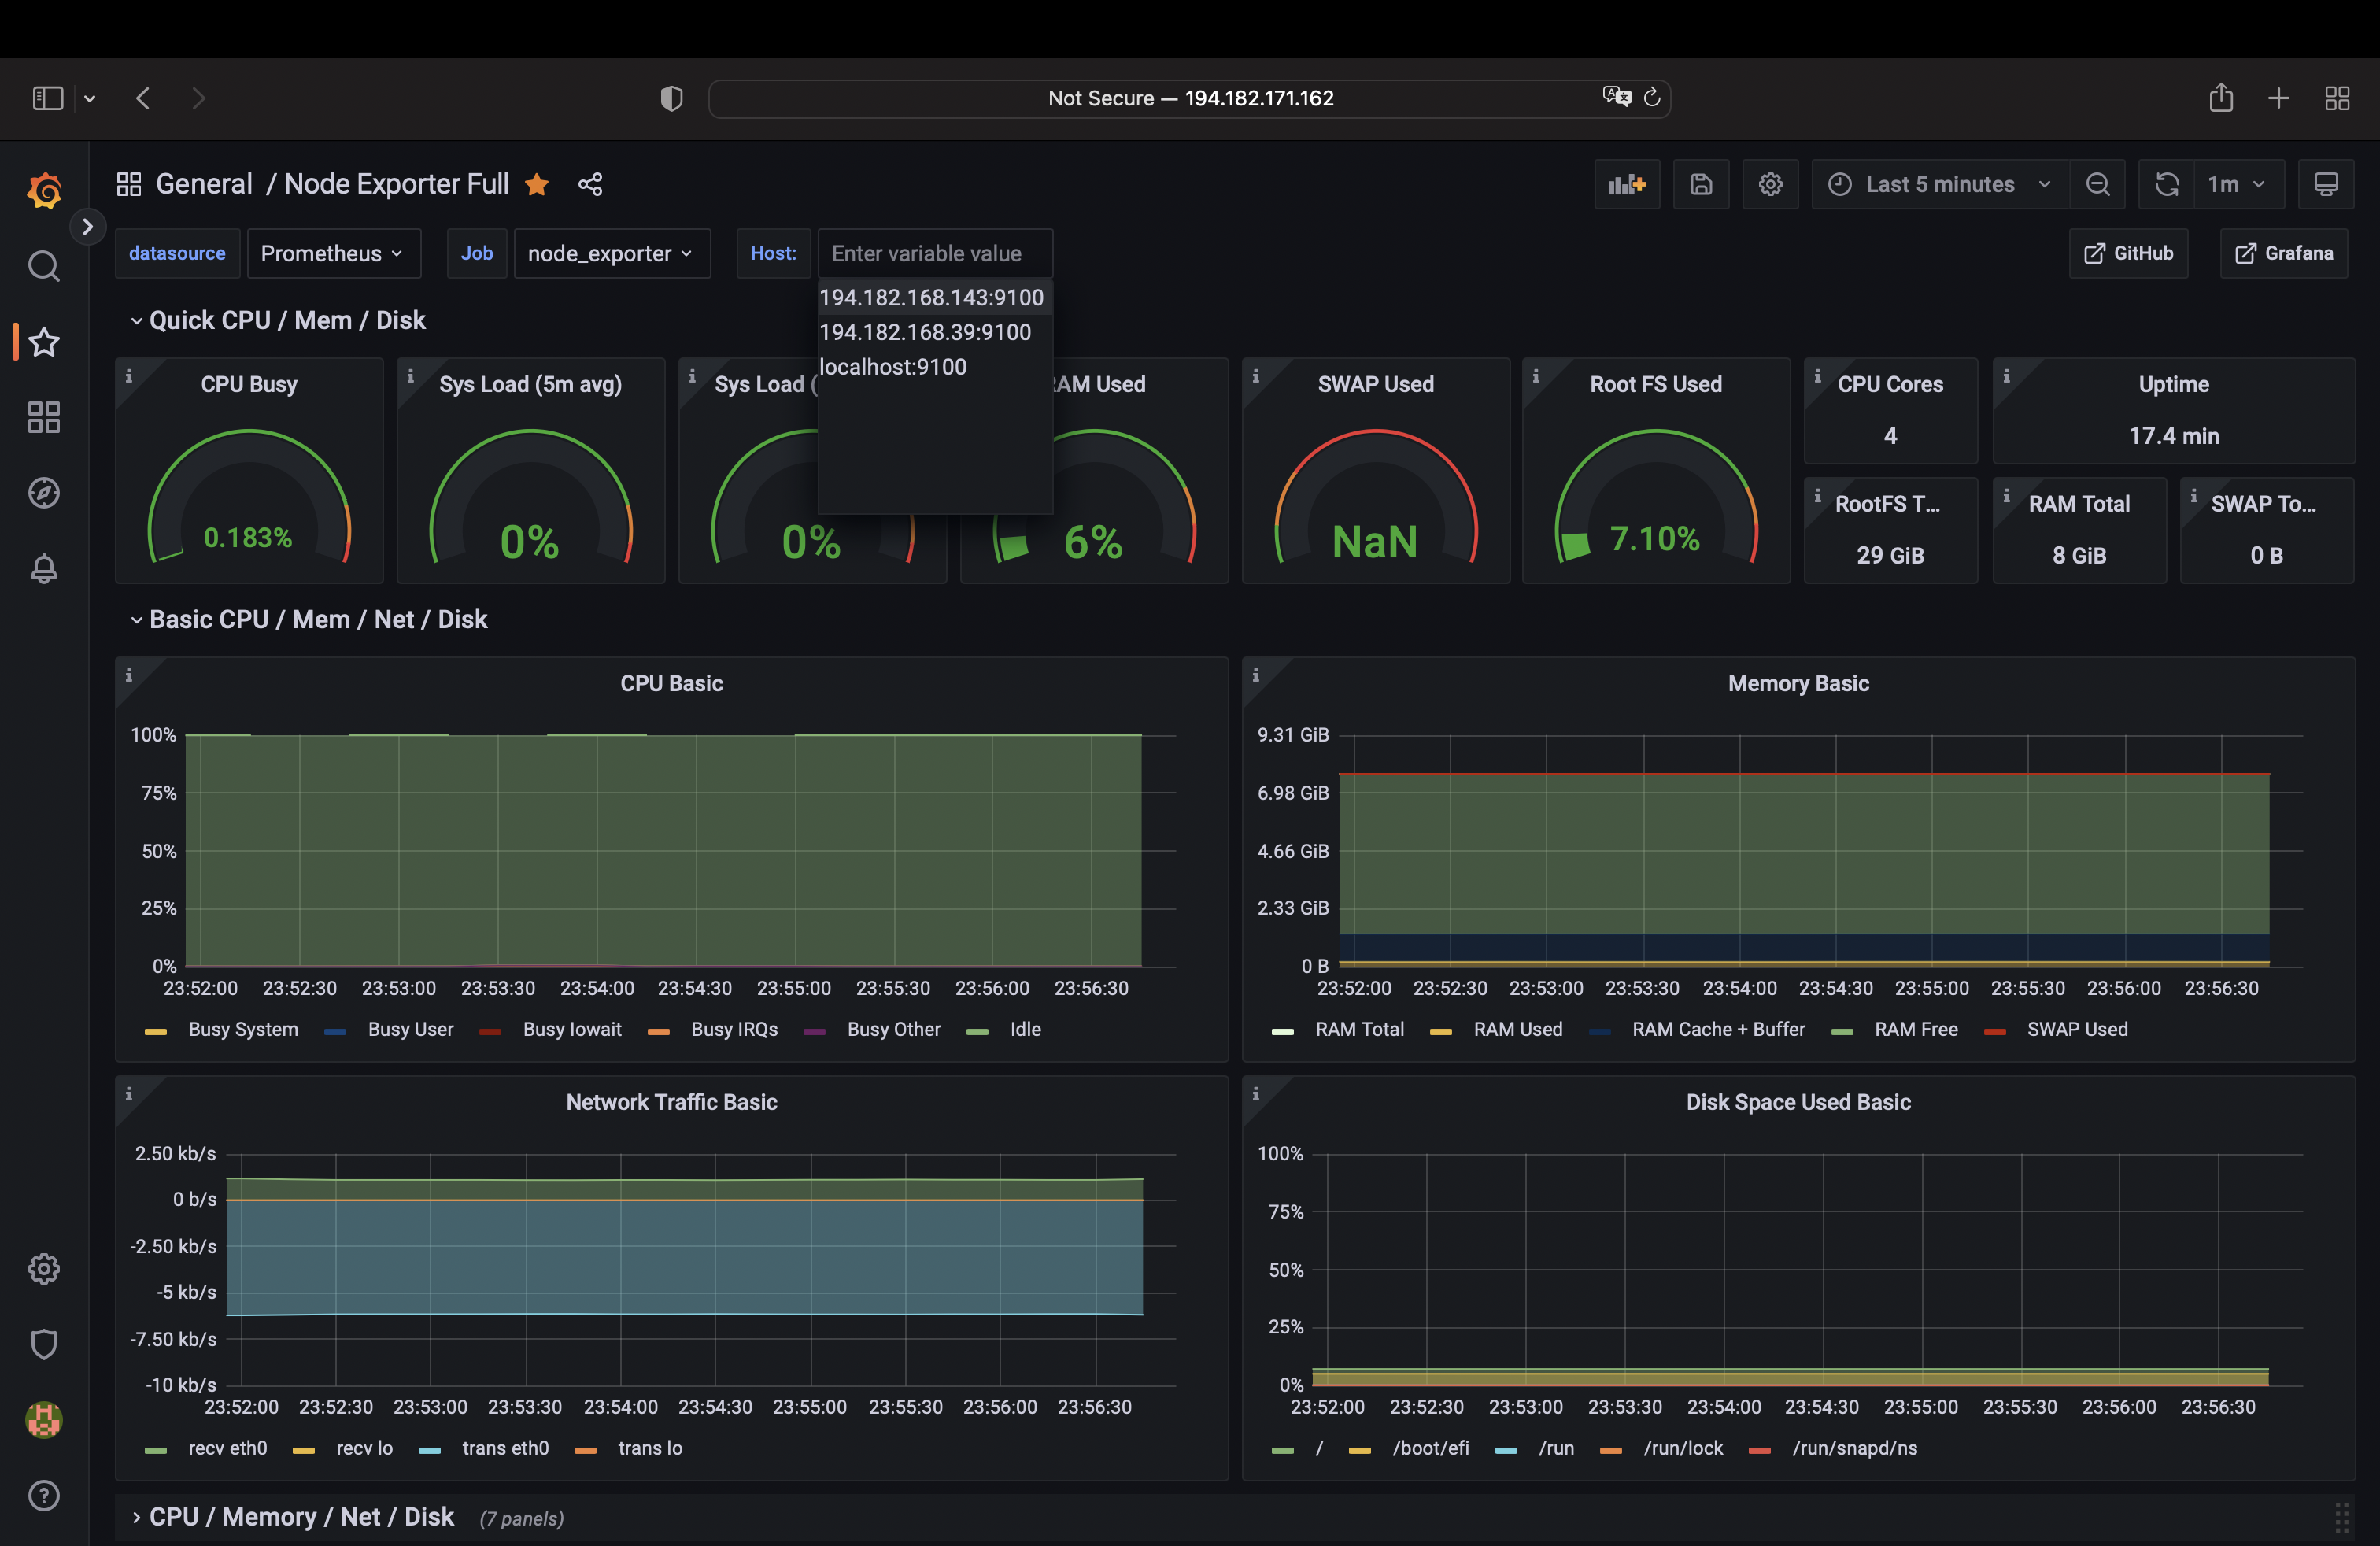
Install, configure and start the Grafana server, accessible via the URL
http://IP-address:3000. -
Create an admin user/password for Grafana
-
Configure data sources: To display data in Grafana, you will need to configure one or more data sources. This typically involves specifying the type of data source (e.g. Prometheus, InfluxDB), the URL of the data source, and any necessary authentication information.
-
Import a dashboard: Once you have configured your data sources, you can import a dashboard and select the appropriate data source.
Prometheus server

Grafana server

It’s worth noting that this is an example of deploying a monitoring stack on Exoscale using IaC.
You can customize it to fit your specific needs, such as alerting, secrets encryption or CI/CD pipelines For further agility and flexibility.
What’s next
Overall, Prometheus and Grafana are a popular and effective combination for monitoring and analyzing the performance and availability of your systems.
By using these tools, you can quickly and easily identify and troubleshoot issues, ensure that your systems are running smoothless.
We are thrilled to inform you that Exoscale has launched a new managed Grafana service.
Check it out on our portal and make sure to explore this exciting new offering!
