How we went from ELK to Kafka for logging at scale
At Exoscale, logging is one of the two key elements of our operational obversability stack. We make sure that we write sensible messages that help us pinpoint or analyze issues quickly with the best possible signal-to-noise ratio.

To this end, we rely on structured logging as much as possible throughout our projects. Structured logging allows us to attach context information to log messages such as organization, or request IDs when they span multiple processes and machines. The idea is to later use this context information to look-up a subset of the log stream in an efficient manner. Most of our key components being written in Clojure and Python, this is made easy to implement by such libraries as unilog and structlog.
Once software logs, how do we go from text files scattered throughout several machines to a centralized log store?
The Elephant Elk in the room
Back in 2012 we started out with the stack now commonly known as ELK for Elasticsearch, Logstash, and Kibana. These three products provide a basis for setting up a centralized logging environment: Logstash is a tool for collecting, filtering, augmenting and storing logs. It provides a wide selection of log input mechanisms, be they local or over the network. A toolbox for working with logs and extracting information from them is provided as well as a wide selection of log outputs.
One of Logstash‘s most well-known outputs is Elasticsearch, a horizontally-scalable full-text search index. Kibana is a frontend for Elasticsearch focusing on providing simple ways to perform and store queries as well as to infer visualizations from them.
With this approach, we benefited from a simple but functional web interface to query logs in a centralized way. Kibana also allowed storing application specific dashboards which became vital in our workflow.
As far as Logstash was concerned, we essentially used the following features:
- Syslog interoperability for system message collection
- JSON parsing of files
- The Elasticsearch, Redis, and Riemann outputs
- Simple filters to limit output to Riemann
- Nginx and Haproxy format parsing
While this trio was satisfactory for our early needs, we struggled with a few points:
Node footprint
Implemented as a JRuby process, logstash, present on all nodes consumed a consequent amount of resources. Additionally loading the JRuby runtime on top of the JVM resulted in very slow startup times making iterating over functionality and filters a painful process.
Lack of buffering
While simple in nature this architecture did not allow for partial outages and exhibited worrying behaviors during them, with logstash failing to stop queuing up messages when deliveries failed.
High cost of cluster rebuilds
Any error or corruption on Elasticsearch indices resulted in long and difficult maintenances with proved a burden to operations.
Our shopping list
We quickly used redis as a buffer for messages, fully knowing it was only a temporary solution, since its memory-only storage only bought us so much time in the case of index outages.
In the meantime, we set out to find a long-term solution with the following prerequisites:
- A low-overhead agent which would retain all of logstash’s feature-set.
- A solid queuing mechanism, if possible Apache Kafka which we were already using for other stream processing use-cases.
- The ability to keep on using Kibana to access our logs.
Teaching an old dog new tricks
The first place we looked at was traditional logging daemons to see what capacity they would have to filter and disect logs. It turns out, syslog-ng came packed with great features:
- Great message dissecting abilities
- JSON formatting support
- Syslog (obviously!), file and network input
- Date normalization support
- Message metadata support
- Riemann output!
We even found some great gems in syslog-ng‘s configuration. While parsing HTTP logs from nginx or HAproxy required the use of the burdensome grok language in logstash, here we could do with a simple CSV parser using the quote-pairs option:
parser p_nginx {
  csv-parser(flags(escape-double-char,strip-whitespace)
             delimiters(" ")
             quote-pairs('""[]'));
}
Parsing files already formatted in JSON proved really simple as well:
parser p_jsoneventv1 {
  json-parser(prefix(".eventv1."));
};
Filtering specific messages to send out to riemann for alerting was thankfully supported out of the box. We were thus left with one last thing to work out: shipping logs out to Kafka.
This is what we set out to build which was quickly integrated in the syslog-ng incubator (https://github.com/balabit/syslog-ng-incubator/pull/77), and then merged in the mainline syslog-ng project. With this, we could ship all logs to kafka, formatted in JSON for later consumption.
destination {
   kafka(properties(metadata.broker.list("...")
                    security.protocol("ssl")
                    ssl.key.location("...")
                    ssl.certificate.location("...")
                    ssl.ca.location("...")
                    queue.buffering.max.ms(1000))
         topic("logs")
         payload("$(format-json)"));
};
Logstash is a great aggregator
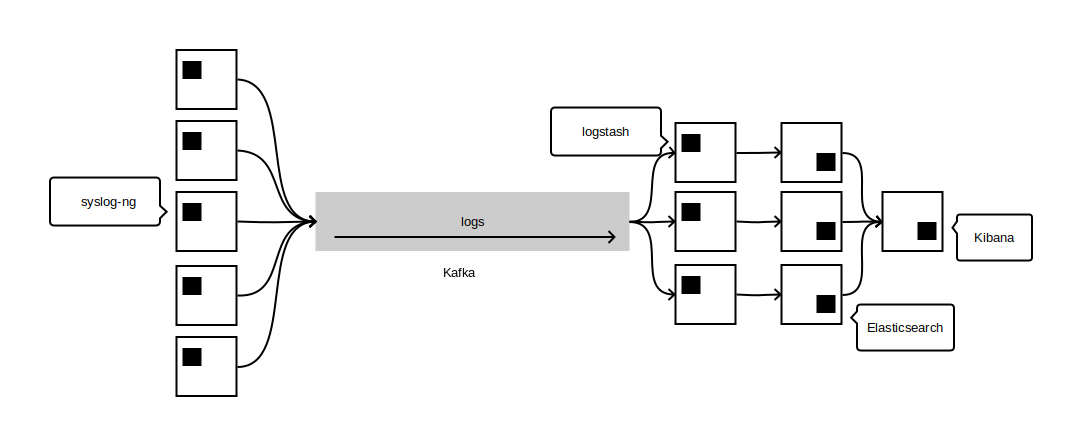
With this set-up we now had a continuous stream of logs, with each message already nicely formatted in JSON, ready for inspection. This opened new opportunities such as plugging consumers dedicated to other tasks than plain indexing of log messages.
We still had to figure out how to pop messages off of the Kafka topic and into Elasticsearch, but luckily, logstash ended-up providing this functionality which we used.
With logstash’s kafka input we ended up with a very solid and scalable way to ingest a large amount of log messages:
Looking back and going forward
With this architecture, our list of prequisites was met, we ended in a situation with a very low overhead on nodes, as well as quick restarts. One could make the argument that syslog-ng’s configuration syntax can be a bit more daunting than logstash’s but with a small time investment we were able to match everything we were doing in logstash. Furthermore, our configuration being built from a collection of snippets provided by our configuration management system, which made the switching painless.
By relying on Apache Kafka we are now able to extract more useful information out of logs and run experiments on the log stream as well, which is a great asset.
As far as storage is concerned, we only keep two months’ worth of data indexed, the rest is archived to cold storage to avoid dedicating too many resources to log analysis.
Last, while we still use logstash at the aggregation layer, we use almost none of its capabilities and will be investigating moving to unklog in the future to reduce even further the footprint of our obversability infrastructure.