Deploying Gravitee API Management on Exoscale SKS
 François Mouraine
Quick summary of this article
- For companies exposing APIs, an API Management platform is mandatory: it proxies and secures the backends, controls access with API keys, rate limiting and spike arrest, and offers developers a self-service API catalog.
- Gravitee APIM is an open-source API management platform made of a Gateway (data plane), a Management API, a Console and a Developer Portal, backed by MongoDB for configuration and Elasticsearch for analytics.
- On Exoscale, the whole stack runs on an SKS cluster provisioned with Terraform, with an Exoscale Network Load Balancer created automatically by the Traefik LoadBalancer Service.
- The Exoscale NLB preserves the client source IP, so the node security group must open the NodePort range to client IPs: the whole internet for tests, only known public IPs in production.
- Traffic is routed with the Kubernetes Gateway API rather than an Ingress controller: one Gateway owned by the platform, one HTTPRoute per Gravitee component, and no controller-specific annotations.
- cert-manager issues one Let's Encrypt certificate per Gateway listener, and MongoDB and Elasticsearch persist their data on Exoscale Block Storage through the CSI driver.
- A single Bash script chains the Gateway API CRDs, the Helm releases for Traefik, cert-manager, MongoDB, Elasticsearch and Gravitee, and the Gateway and HTTPRoute manifests that expose them.
- For production, move the data layer to Exoscale managed databases, enable authentication everywhere and restrict access to the Console and Management API.
APIs have become the front door of most digital products. Companies expose them to partners, to mobile and web apps, and between internal teams. Exposing backend services directly is not an option: each team would have to reimplement security, access control and protection against abuse, with no global view of who calls what. For any enterprise that needs to secure its APIs, present them to developers and control who can use them, an API Management (APIM) platform quickly becomes mandatory.
An APIM platform sits between API consumers and your backends and brings:
- Security: backends are never exposed directly. The API gateway proxies every call and enforces authentication (API keys, OAuth2, JWT or mTLS) before a request reaches your services.
- Access management and traffic control: consumers subscribe to plans that define what they can call and how much, with rate limiting, quotas and spike arrest to absorb sudden bursts and protect your backends.
- An API catalog for developers: a developer portal where internal teams and partners discover the available APIs, read their OpenAPI documentation and subscribe in self-service, without opening a ticket.
- Visibility: analytics and logs per API and per consumer, to understand usage, troubleshoot incidents and, if needed, bill for consumption.
- Governance: a single place to publish, version and retire APIs consistently across teams.
Gravitee covers all of these, and it is one of the most popular open-source APIM solutions. Its Community Edition is Apache 2.0 licensed and developed in the open at gravitee-io/gravitee-api-management, and it can be fully self-hosted. Running it on Exoscale SKS means your API traffic, your API keys and your analytics stay in European data centers, on infrastructure you control.
In this article, we will:
- describe the architecture of a Gravitee APIM deployment on Exoscale,
- explain how each piece maps to Exoscale services: SKS, Network Load Balancer, Block Storage and security groups,
- walk through the Terraform, Helm and Bash code that deploys it end to end in about 20 minutes.
What we are building
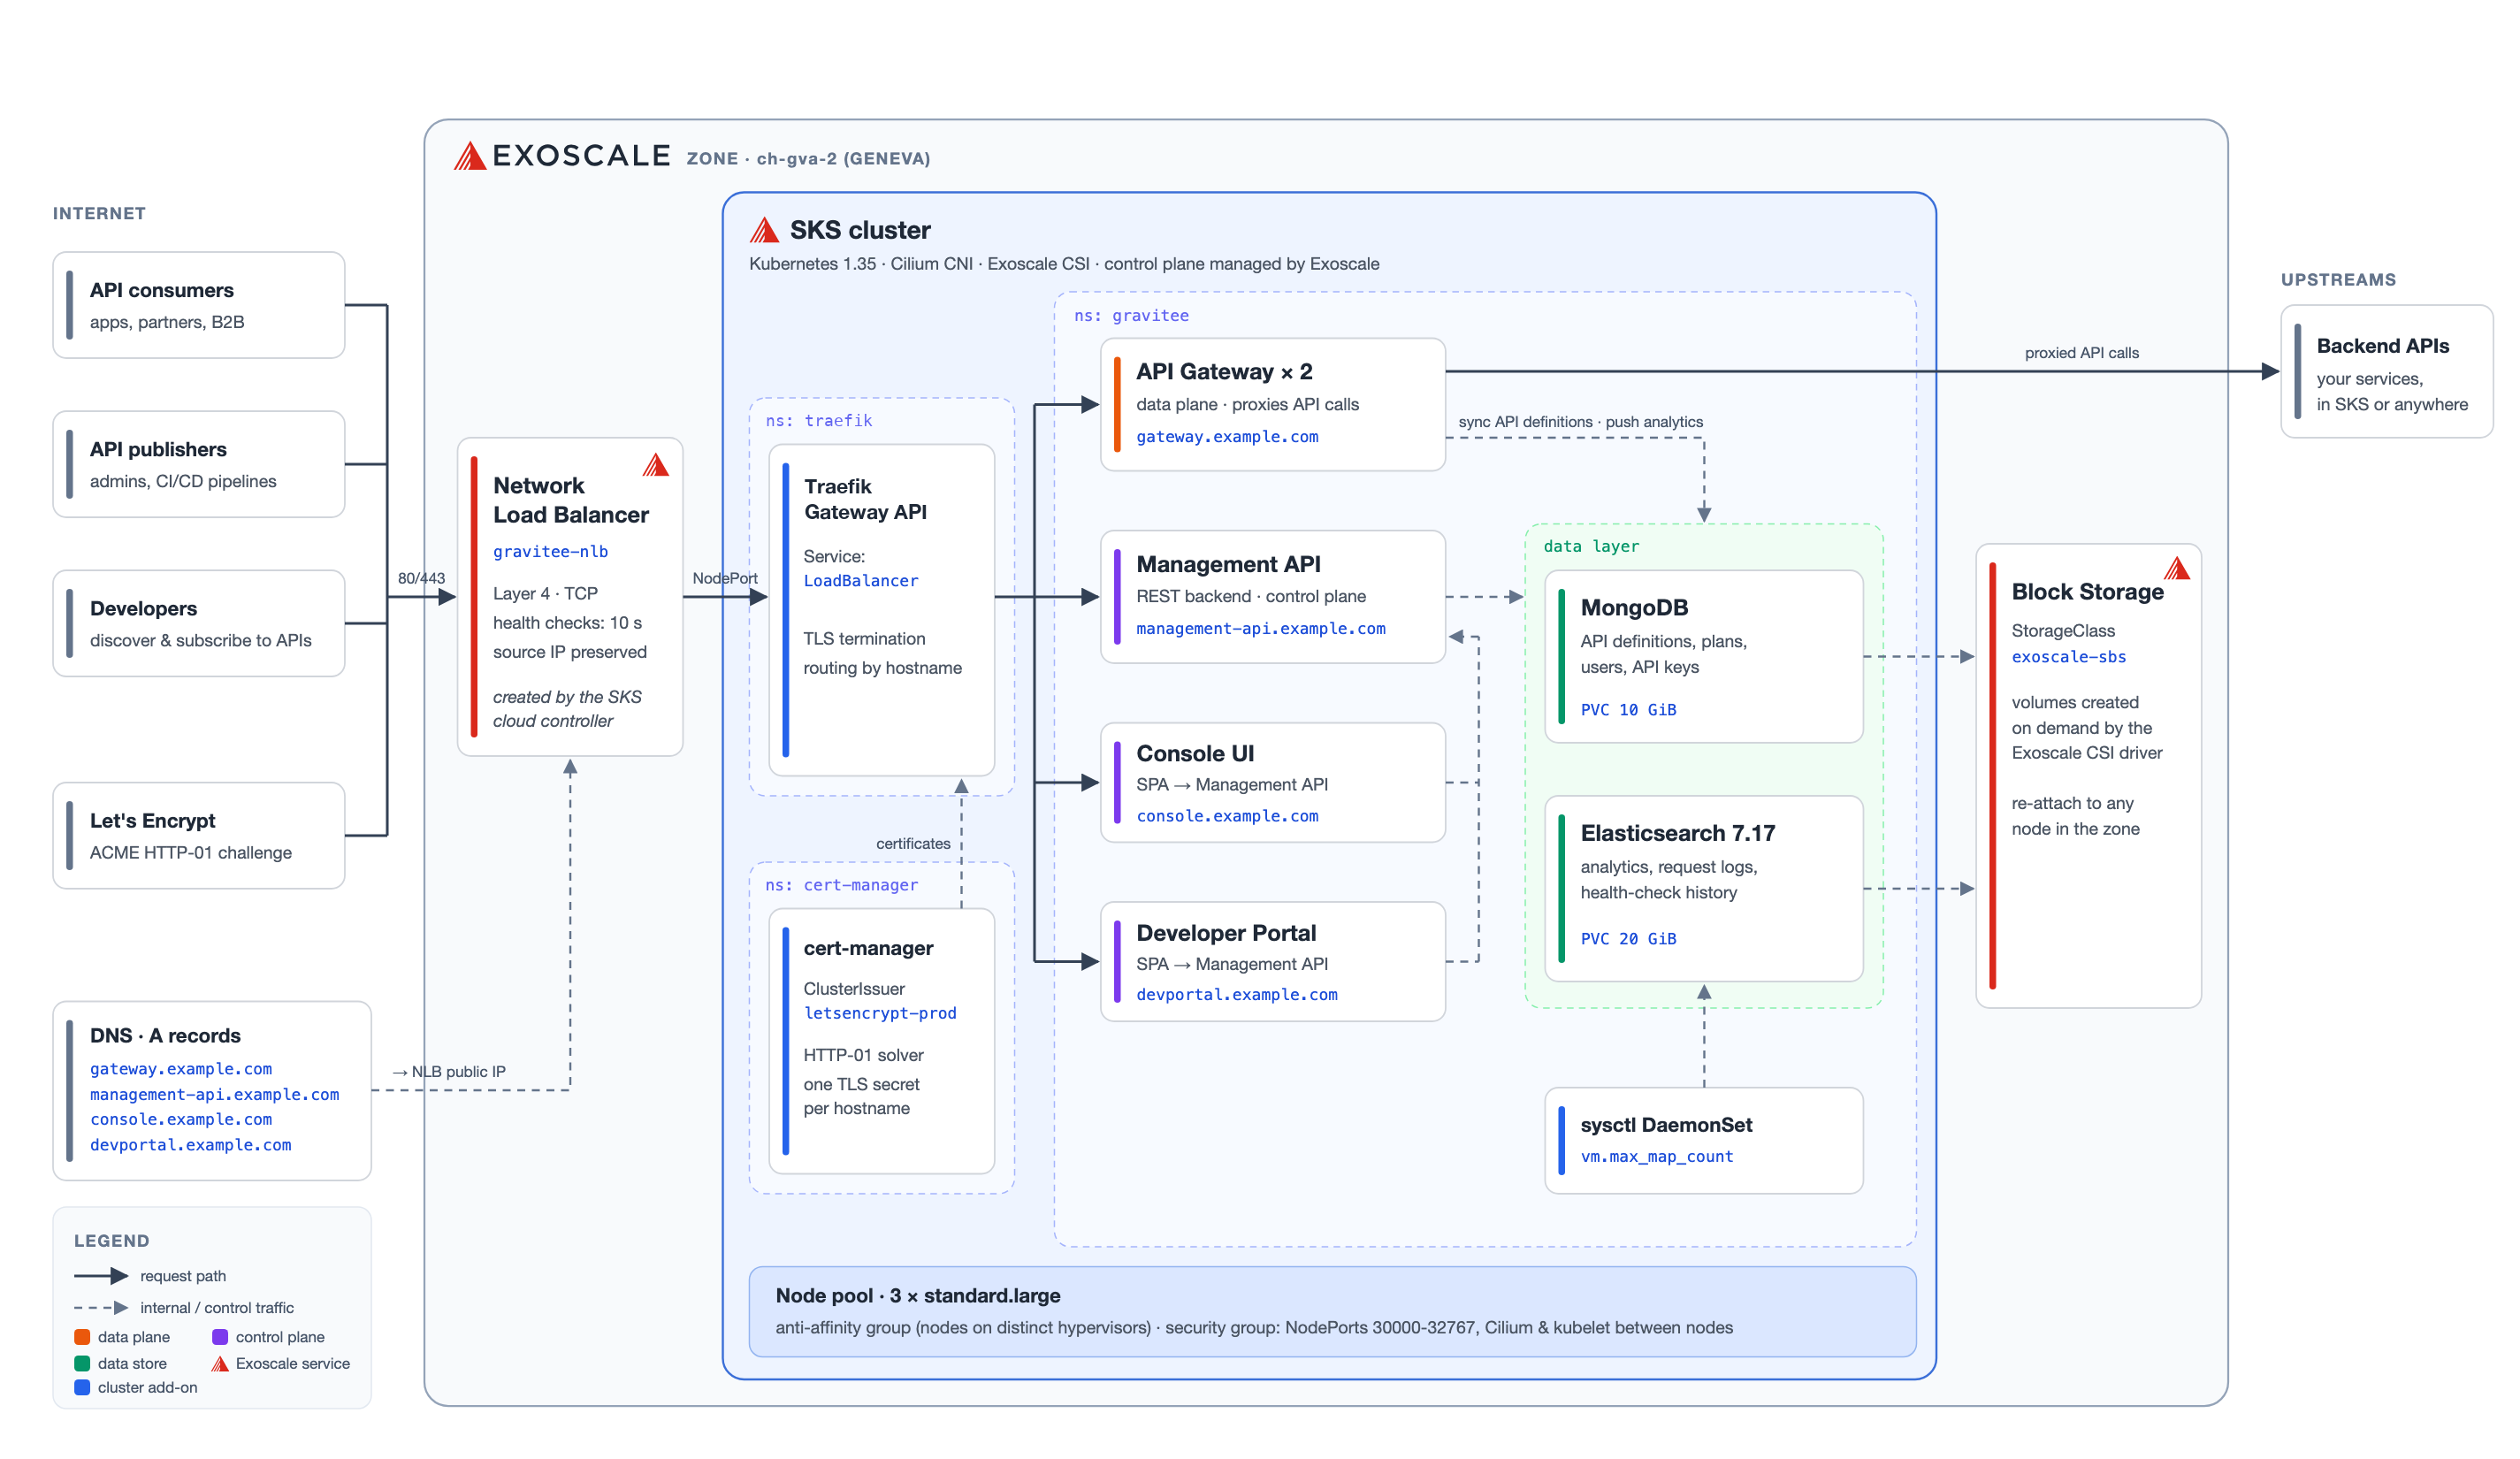
Everything runs in a single Exoscale zone (ch-gva-2, Geneva, in this example) on an SKS cluster with three standard.large worker nodes. Here are the building blocks:
| Component | Role | Exposed at |
|---|---|---|
| API Gateway (2 replicas) | Data plane: receives API calls, applies plans and policies (API keys, rate limits, transformations) and proxies to your backends | gateway.example.com |
| Management API | Control plane REST API, used by the Console, the Portal and your CI/CD pipelines | management-api.example.com |
| Console UI | Web UI for API publishers and administrators | console.example.com |
| Developer Portal | Self-service portal where API consumers discover APIs and subscribe to plans | devportal.example.com |
| MongoDB | Configuration repository: API definitions, plans, applications, subscriptions, users, rate-limit counters | internal |
| Elasticsearch | Analytics repository: request metrics, logs, health-check history | internal |
| Traefik | Gateway API controller: terminates TLS and routes requests by hostname | behind the NLB |
| cert-manager | Issues and renews Let’s Encrypt certificates | internal |
| Gateway API | Gateway and HTTPRoute resources describing the routing, with no controller-specific annotation | n/a |
MongoDB and Elasticsearch are Gravitee’s default backends. Step 6 explains how to replace them with Exoscale managed PostgreSQL and OpenSearch.
How it works on Exoscale
Terraform provisions the cluster, Kubernetes provisions the rest
Terraform only creates the long-lived infrastructure: the SKS cluster, its node pool, an anti-affinity group and a security group. Everything else, including the load balancer and the disks, is created by Kubernetes itself, through the two Exoscale integrations that ship with SKS:
- the Exoscale Cloud Controller Manager (CCM) watches Services of type
LoadBalancerand creates a matching Exoscale Network Load Balancer (NLB), - the Exoscale CSI driver (
exoscale_csi = true) watches PersistentVolumeClaims using theexoscale-sbsStorageClass and creates Block Storage volumes on demand.
This split keeps Terraform simple and lets Helm charts manage their own cloud resources, just like on any other managed Kubernetes.
Routing with the Gateway API, not with Ingress
The obvious way to publish four hostnames used to be an Ingress controller. We use the Gateway API instead, for two reasons. The first is that the ingress-nginx project has been retired by upstream Kubernetes, so building a new platform on it means starting with a dependency that no longer receives fixes. The second is that Ingress only describes routing in a portable way up to a point: everything beyond “this host goes to that Service” ends up in controller-specific annotations, and the Gravitee chart is a good illustration of that, as Step 7 shows.
The Gateway API splits the same job into three resources, along the lines of who owns what:
- a
GatewayClassnames the controller. Traefik’s Helm chart creates one for us. - a
Gatewayis the entry point: ports, protocols, hostnames and TLS certificates. It belongs to whoever runs the platform, and it is the resource behind theLoadBalancerService, and therefore behind the Exoscale NLB. - an
HTTPRouteattaches to aGatewayand says which paths go to which Service. It belongs to whoever ships the application, and it lives in the application’s own namespace.
We use Traefik as the controller, following Use Gateway API on SKS. Any conformant implementation would do, and the Exoscale-specific part, the LoadBalancer Service annotations, is identical for all of them.
The Network Load Balancer, and why the security group matters
When the Traefik chart creates its LoadBalancer Service, the CCM provisions an NLB named gravitee-nlb, with one service per port (80 and 443). Each NLB service targets the Instance Pool behind the SKS node pool on the NodePort that Kubernetes allocated. If you scale the node pool, the NLB follows automatically. Health checks are tuned through Service annotations (every 10 s, 2 successes to be healthy, 3 failures to be evicted). The SKS Load Balancer and Ingress Controller documentation lists all the available annotations.
The Exoscale NLB is a layer 4 load balancer that preserves the client source IP: packets reach the nodes with the original IP of the caller, not the IP of the load balancer. This has a very concrete consequence:
0.0.0.0/0 in this test setup. Allowing only the NLB health-check sources is not enough: health checks succeed, the NLB marks the nodes as healthy, but real traffic, including the Let’s Encrypt HTTP-01 challenge, is silently dropped and certificate issuance times out. Step 1 shows how to restrict it for production.The upside of source IP preservation: your gateway can see the real client IP, which is useful for IP filtering and meaningful analytics (see Going to production).
TLS with cert-manager and Let’s Encrypt
cert-manager understands the Gateway API too, once it is started with Gateway API support enabled. Our single Gateway carries a cert-manager.io/cluster-issuer: letsencrypt-prod annotation and declares one HTTPS listener per hostname. cert-manager reads those listeners and creates one Certificate per listener, each with its own Secret.
The HTTP-01 challenge follows the same logic: instead of a temporary solver Ingress, cert-manager creates a temporary HTTPRoute attached to the Gateway. Let’s Encrypt calls http://<host>/.well-known/acme-challenge/..., the request goes through DNS, the NLB, the NodePort and Traefik to the solver, and the certificate lands in a Kubernetes Secret that the listener references. That is why the DNS records must point to the NLB before certificates can be issued.
Gravitee’s control plane and data plane
Gravitee separates the management of APIs from the traffic that flows through them:
- the control plane (Management API, Console and Portal) writes API definitions, plans and subscriptions to MongoDB. The Console and Portal are single-page apps: your browser loads them, then calls the Management API directly.
- the data plane (Gateway) polls MongoDB for deployed API definitions and keeps them in memory. It reads and updates rate-limit counters in MongoDB and pushes analytics asynchronously to Elasticsearch.
Because the gateway does not call the Management API at runtime, API traffic keeps flowing even if the control plane is down or being upgraded. Here is what happens for a single API call:
    sequenceDiagram
    autonumber
    participant C as Consumer
    participant N as Exoscale NLB
    participant I as Traefik
    participant G as Gateway
    participant B as Backend
    participant E as Elasticsearch
    C->>N: HTTPS :443
    N->>I: NodePort
    I->>I: TLS termination (Gateway listener)
    I->>G: HTTPRoute, by Host
    G->>G: Plan & policies
    G->>B: Proxied request
    B-->>G: Response
    G-->>C: Response
    G--)E: Analytics (async)
The consumer resolves gateway.example.com to the NLB IP, and the NLB forwards the TCP connection to a NodePort on a healthy node, keeping the client IP. Traefik terminates TLS on the Gateway listener that matches the Host header, with the certificate issued by cert-manager, then hands the request to the HTTPRoute that points at the gateway Service. The gateway matches the context path, applies the plan and its policies, calls the backend, and sends the analytics event to Elasticsearch without delaying the response.
Persistence on Block Storage
MongoDB and Elasticsearch run as StatefulSets whose PVCs use the exoscale-sbs StorageClass. The CSI driver creates a 10 GiB and a 20 GiB Block Storage volume and attaches them to the node running the pod. If the pod moves to another node, the volume is detached and re-attached there, so your configuration and analytics survive rescheduling and node upgrades.
Prerequisites
- An Exoscale account and an API key allowed to manage compute, which includes SKS resources
- Terraform, the
exoCLI,kubectl,helm(3.10 or later) andjq - A domain name you control, to create four DNS records
The code is organized as follows:
.
├── terraform/infra/
│   ├── providers.tf
│   ├── locals.tf
│   ├── main.tf            # SKS cluster, node pool, security group
│   └── outputs.tf
├── helm/gravitee/
│   ├── values.yaml                # Gravitee APIM
│   ├── elasticsearch-values.yaml
│   ├── cert-manager-issuer.yaml
│   ├── gateway.yaml               # Gateway API entry point + TLS listeners
│   ├── httproutes.yaml            # one HTTPRoute per Gravitee component
│   └── sysctl-daemonset.yaml
└── scripts/
    └── deploy-gravitee.sh
Throughout the article, replace example.com with your own domain.
Step 1: Provision the SKS cluster with Terraform
Keep credentials out of your code: both the Terraform provider and the exo CLI read them from the environment.
export EXOSCALE_API_KEY="EXO..."
export EXOSCALE_API_SECRET="..."
providers.tf declares the providers. The commented-out backend stores the Terraform state in an Exoscale SOS bucket, which is a good idea as soon as more than one person works on the infrastructure.
terraform {
  required_providers {
    exoscale = { source = "exoscale/exoscale" }
    external = { source = "hashicorp/external" }
    local    = { source = "hashicorp/local" }
  }

  # backend "s3" {
  #   bucket    = "my-terraform-state"
  #   key       = "gravitee/terraform.tfstate"
  #   region    = "ch-gva-2"
  #   endpoints = { s3 = "https://sos-ch-gva-2.exo.io" }
  #
  #   skip_credentials_validation = true
  #   skip_region_validation      = true
  #   skip_requesting_account_id  = true
  # }
}

# Credentials come from EXOSCALE_API_KEY / EXOSCALE_API_SECRET
provider "exoscale" {}
locals.tf sets the zone and the Kubernetes minor version:
locals {
  zone            = "ch-gva-2"
  cluster_version = "1.35"
}
main.tf holds the infrastructure itself. An external data source asks the exo CLI for the latest patch release of the targeted minor version, so you never pin an outdated patch release.
data "exoscale_security_group" "default" {
  name = "default"
}

# Latest SKS patch release for the targeted minor version (e.g. 1.35.x)
data "external" "latest_sks_version" {
  program = ["bash", "-c", <<-EOT
    exo compute sks versions --zone ${local.zone} -O json \
      | jq '{version: first(.[] | select(.version | startswith("${local.cluster_version}")) | .version)}'
  EOT
  ]
}

resource "exoscale_sks_cluster" "gravitee" {
  zone         = local.zone
  name         = "gravitee-sks"
  version      = data.external.latest_sks_version.result.version
  cni          = "cilium"
  exoscale_csi = true # Block Storage volumes for PVCs
  auto_upgrade = true
}

# Spread worker nodes across distinct hypervisors
resource "exoscale_anti_affinity_group" "gravitee" {
  name = "gravitee-sks-anti-affinity"
}

resource "exoscale_security_group" "gravitee" {
  name = "gravitee-sks-nodes"
}

# NLB health checks
resource "exoscale_security_group_rule" "nodeport_nlb_healthcheck" {
  security_group_id     = exoscale_security_group.gravitee.id
  description           = "NodePorts from NLB health checks"
  type                  = "INGRESS"
  protocol              = "TCP"
  start_port            = 30000
  end_port              = 32767
  public_security_group = "public-nlb-healthcheck-sources"
}

# The NLB preserves the client source IP: real traffic (users, Let's Encrypt)
# reaches the NodePorts with internet addresses and must be allowed.
# FOR TESTS ONLY: restrict the source ranges in production (see below).
resource "exoscale_security_group_rule" "nodeport_internet" {
  security_group_id = exoscale_security_group.gravitee.id
  description       = "NodePorts from the internet (NLB passthrough)"
  type              = "INGRESS"
  protocol          = "TCP"
  start_port        = 30000
  end_port          = 32767
  cidr              = "0.0.0.0/0"
}

# Traffic between worker nodes: kubelet and Cilium
locals {
  node_to_node_rules = {
    kubelet       = { protocol = "TCP", port = 10250, description = "Kubelet" }
    cilium_vxlan  = { protocol = "UDP", port = 8472, description = "Cilium VXLAN" }
    cilium_health = { protocol = "TCP", port = 4240, description = "Cilium health checks" }
  }
}

resource "exoscale_security_group_rule" "node_to_node" {
  for_each = local.node_to_node_rules

  security_group_id      = exoscale_security_group.gravitee.id
  description            = each.value.description
  type                   = "INGRESS"
  protocol               = each.value.protocol
  start_port             = each.value.port
  end_port               = each.value.port
  user_security_group_id = exoscale_security_group.gravitee.id
}

resource "exoscale_security_group_rule" "cilium_health_icmp" {
  security_group_id      = exoscale_security_group.gravitee.id
  description            = "Cilium health checks (ICMP)"
  type                   = "INGRESS"
  protocol               = "ICMP"
  icmp_type              = 8
  icmp_code              = 0
  user_security_group_id = exoscale_security_group.gravitee.id
}

resource "exoscale_sks_nodepool" "gravitee" {
  zone          = local.zone
  cluster_id    = exoscale_sks_cluster.gravitee.id
  name          = "gravitee-nodepool"
  instance_type = "standard.large"
  size          = 3

  anti_affinity_group_ids = [exoscale_anti_affinity_group.gravitee.id]
  security_group_ids = [
    data.exoscale_security_group.default.id,
    exoscale_security_group.gravitee.id,
  ]
}

# Short-lived admin kubeconfig, renewed by the next `terraform apply`
resource "exoscale_sks_kubeconfig" "admin" {
  zone       = local.zone
  cluster_id = exoscale_sks_cluster.gravitee.id

  user   = "kubernetes-admin"
  groups = ["system:masters"]

  ttl_seconds           = 3600
  early_renewal_seconds = 300
}

resource "local_sensitive_file" "kubeconfig" {
  filename        = "kubeconfig"
  content         = exoscale_sks_kubeconfig.admin.kubeconfig
  file_permission = "0600"
}
The nodeport_internet rule opens the NodePorts to the whole internet (0.0.0.0/0). Keep it for tests only. In production, allow only the public IP addresses that really need to reach your platform, for example your company’s public egress IPs, your partners’ public IPs, or the public ranges of a CDN or WAF placed in front of the gateway. Because the Exoscale NLB preserves the client source IP, the security group sees the real caller and can filter it. Keep the nodeport_nlb_healthcheck rule, or the NLB will consider every node unhealthy.
Let’s Encrypt does not publish the IP addresses it validates from. Once the NodePorts are restricted, HTTP-01 challenges fail, so switch cert-manager to the DNS-01 challenge in that case.
To restrict access, replace nodeport_internet with one rule per allowed range:
variable "allowed_cidrs" {
  description = "Public IP ranges allowed to reach the NodePorts"
  type        = list(string)
  default     = ["203.0.113.0/24", "198.51.100.10/32"] # replace with your own public IPs
}

resource "exoscale_security_group_rule" "nodeport_allowed" {
  for_each = toset(var.allowed_cidrs)

  security_group_id = exoscale_security_group.gravitee.id
  description       = "NodePorts from ${each.value}"
  type              = "INGRESS"
  protocol          = "TCP"
  start_port        = 30000
  end_port          = 32767
  cidr              = each.value
}
And outputs.tf prints a handy connection command:
output "sks_endpoint" {
  value = exoscale_sks_cluster.gravitee.endpoint
}

output "sks_connection" {
  value = "export KUBECONFIG=${abspath(local_sensitive_file.kubeconfig.filename)}; kubectl get nodes"
}
Apply it:
cd terraform/infra
terraform init
terraform apply
export KUBECONFIG=$(pwd)/kubeconfig
kubectl get nodes
After a few minutes, three nodes show up as Ready. The kubeconfig is valid for one hour. Run terraform apply again to renew it when it expires.
Step 2: Install the Gateway API CRDs and Traefik
From now on, everything is done with Helm and kubectl. The snippets below are extracts of scripts/deploy-gravitee.sh, available in full at the end of the article.
The Gateway API is not part of the Kubernetes core API: its CRDs ship separately. The standard channel is all we need: it contains GatewayClass, Gateway and HTTPRoute.
kubectl apply -f https://github.com/kubernetes-sigs/gateway-api/releases/download/v1.6.1/standard-install.yamlThen install Traefik as the Gateway API controller. Its LoadBalancer Service is what makes the Exoscale CCM create the NLB, exactly as an ingress controller would:
helm repo add --force-update graviteeio https://helm.gravitee.io
helm repo add --force-update traefik    https://traefik.github.io/charts
helm repo add --force-update jetstack   https://charts.jetstack.io
helm repo add --force-update bitnami    https://charts.bitnami.com/bitnami
helm repo add --force-update elastic    https://helm.elastic.co
helm repo update

helm upgrade --install traefik traefik/traefik \
  --namespace traefik --create-namespace \
  --version "41.5.0" \
  --set providers.kubernetesGateway.enabled=true \
  --set providers.kubernetesIngress.enabled=false \
  --set gateway.enabled=false \
  --set service.annotations."service\.beta\.kubernetes\.io/exoscale-loadbalancer-name"="gravitee-nlb" \
  --set service.annotations."service\.beta\.kubernetes\.io/exoscale-loadbalancer-service-healthcheck-interval"="10s" \
  --set service.annotations."service\.beta\.kubernetes\.io/exoscale-loadbalancer-service-healthcheck-timeout"="5s" \
  --set service.annotations."service\.beta\.kubernetes\.io/exoscale-loadbalancer-service-healthcheck-strikes-ok"="2" \
  --set service.annotations."service\.beta\.kubernetes\.io/exoscale-loadbalancer-service-healthcheck-strikes-fail"="3" \
  --wait
Three flags shape what Traefik does:
providers.kubernetesGateway.enabled=trueturns on the Gateway API provider and makes the chart create aGatewayClassnamedtraefik, bound to the controllertraefik.io/gateway-controller.providers.kubernetesIngress.enabled=falseturns off the Ingress provider. Nothing in this platform uses Ingress, and leaving it on would only make Traefik watch resources we never create.gateway.enabled=falsestops the chart from creating its own plain-HTTPGateway. We write our own in Step 5, with one TLS listener per hostname.
The service.beta.kubernetes.io/exoscale-loadbalancer-* annotations are read by the Exoscale CCM: they name the NLB and tune its health checks. A minute later, the NLB appears in the Exoscale Portal, and its public IP shows up in the Service status. The SKS Load Balancer and Ingress Controller documentation lists all the available annotations.
kubectl get gatewayclass
kubectl get svc traefik -n traefik8000 (web) and 8443 (websecure); the Service publishes them as 80 and 443. So the Gateway of Step 5 declares listeners on 8000 and 8443. If the ports do not match, Traefik logs an error and the listener never becomes ready. You can also set ports.web.port=80 and ports.websecure.port=443 in the chart, at the price of granting the container the NET_BIND_SERVICE capability.Step 3: Install cert-manager and a Let’s Encrypt issuer
helm upgrade --install cert-manager jetstack/cert-manager \
  --namespace cert-manager --create-namespace \
  --version "v1.21.2" \
  --set crds.enabled=true \
  --set config.enableGatewayAPI=true \
  --wait
kubectl rollout status deployment/cert-manager-webhook -n cert-manager --timeout=120s
config.enableGatewayAPI=true is what makes cert-manager watch annotated Gateway resources and solve challenges with HTTPRoutes. cert-manager only checks for the Gateway API CRDs at startup, which is why Step 2 installs them first: install them afterwards and you have to restart the cert-manager pods.
The ClusterIssuer uses the Let’s Encrypt production endpoint and the HTTP-01 solver, pointed at the Gateway we are about to create (helm/gravitee/cert-manager-issuer.yaml):
apiVersion: cert-manager.io/v1
kind: ClusterIssuer
metadata:
  name: letsencrypt-prod
spec:
  acme:
    server: https://acme-v02.api.letsencrypt.org/directory
    email: you@example.com   # expiry notices are sent here
    privateKeySecretRef:
      name: letsencrypt-prod
    solvers:
      - http01:
          # cert-manager creates a temporary HTTPRoute attached to this Gateway
          gatewayHTTPRoute:
            parentRefs:
              - name: gravitee
                namespace: traefik
                kind: Gateway
                group: gateway.networking.k8s.io
The ClusterIssuer can be applied before the Gateway exists: it is only read when a certificate is actually requested.
Step 4: Point your DNS records to the NLB
Retrieve the NLB public IP:
kubectl get svc traefik -n traefik \
  -o jsonpath='{.status.loadBalancer.ingress[0].ip}'
Then create four A records pointing to it: gateway, management-api, console and devportal. If your zone is hosted on Exoscale DNS, the exo CLI does it in one loop:
NLB_IP=$(kubectl get svc traefik -n traefik \
  -o jsonpath='{.status.loadBalancer.ingress[0].ip}')

for name in gateway management-api console devportal; do
  exo dns add A example.com --name "$name" --address "$NLB_IP" --ttl 300
done
Wait until the records resolve (dig +short gateway.example.com) before creating the Gateway, so the first certificate requests succeed.
Step 5: Create the Gateway and its certificates
The Gateway is the entry point of the whole platform: one plain-HTTP listener, used by the ACME challenges and by the redirection to HTTPS, and one HTTPS listener per hostname (helm/gravitee/gateway.yaml):
apiVersion: gateway.networking.k8s.io/v1
kind: Gateway
metadata:
  name: gravitee
  namespace: traefik
  annotations:
    # cert-manager issues one certificate per HTTPS listener below
    cert-manager.io/cluster-issuer: letsencrypt-prod
spec:
  gatewayClassName: traefik
  listeners:
    # Traefik entryPoints: web = 8000, websecure = 8443.
    # The Service publishes them as 80 and 443.
    - name: http
      protocol: HTTP
      port: 8000
      allowedRoutes:
        namespaces:
          from: Same          # only the ACME solver and the redirect below
    - name: gateway-https
      protocol: HTTPS
      port: 8443
      hostname: gateway.example.com
      tls:
        mode: Terminate
        certificateRefs:
          - name: gateway-tls
      allowedRoutes:
        namespaces:
          from: All           # HTTPRoutes live in the gravitee namespace
    - name: management-api-https
      protocol: HTTPS
      port: 8443
      hostname: management-api.example.com
      tls:
        mode: Terminate
        certificateRefs:
          - name: management-api-tls
      allowedRoutes:
        namespaces:
          from: All
    - name: console-https
      protocol: HTTPS
      port: 8443
      hostname: console.example.com
      tls:
        mode: Terminate
        certificateRefs:
          - name: console-tls
      allowedRoutes:
        namespaces:
          from: All
    - name: devportal-https
      protocol: HTTPS
      port: 8443
      hostname: devportal.example.com
      tls:
        mode: Terminate
        certificateRefs:
          - name: devportal-tls
      allowedRoutes:
        namespaces:
          from: All
---
# Everything that arrives in plain HTTP is redirected to HTTPS. The ACME
# challenge routes created by cert-manager carry an exact hostname and a
# /.well-known/acme-challenge/ path, both more specific than this catch-all,
# so they keep winning and certificate issuance is never redirected away.
apiVersion: gateway.networking.k8s.io/v1
kind: HTTPRoute
metadata:
  name: https-redirect
  namespace: traefik
spec:
  parentRefs:
    - name: gravitee
      sectionName: http
  rules:
    - filters:
        - type: RequestRedirect
          requestRedirect:
            scheme: https
            statusCode: 301
allowedRoutes is where the role separation becomes concrete. The Gateway lives in the traefik namespace and is owned by whoever runs the platform; the Gravitee HTTPRoutes live in the gravitee namespace and are owned by whoever runs the APIM. from: All is what allows that cross-namespace attachment, and a Selector on the namespace label is the tighter variant to use on a shared cluster.
Apply it and watch the four certificates being issued:
kubectl apply -f helm/gravitee/gateway.yaml

kubectl get gateway gravitee -n traefik
kubectl get certificate -n traefik
Each listener stays Programmed=False until its Secret exists, so the Gateway only becomes fully ready once Let’s Encrypt has answered. Issuance usually takes under a minute per hostname; if it hangs, kubectl describe challenge -n traefik tells you which step is stuck, and the usual culprit is the NodePort security-group rule from Step 1.
Step 6: Deploy MongoDB and Elasticsearch
The Gravitee chart can embed MongoDB and Elasticsearch as subcharts, but we deploy them as separate Helm releases. This decouples their lifecycle from Gravitee upgrades and avoids stale subchart image tags.
MongoDB and Elasticsearch are Gravitee’s default backends, and the ones its Helm chart proposes, which is why we use them here. You can replace both with Exoscale managed databases (DBaaS):
- MongoDB → Exoscale Managed PostgreSQL, through Gravitee’s JDBC repository. It stores the same data: API definitions, applications, subscriptions, users and rate-limit counters.
- Elasticsearch → Exoscale Managed OpenSearch, for analytics and request logs.
Both services run in the same zone as your SKS cluster, and Exoscale handles backups, high availability and upgrades. This also removes the StatefulSets, the Block Storage volumes and the sysctl DaemonSet from the cluster. Check Gravitee’s compatibility matrix for the PostgreSQL and OpenSearch versions your APIM version supports.
Elasticsearch needs the kernel setting vm.max_map_count=262144 on every node. A tiny DaemonSet (helm/gravitee/sysctl-daemonset.yaml) sets it once per node, including nodes added later when you scale the node pool:
apiVersion: apps/v1
kind: DaemonSet
metadata:
  name: elasticsearch-sysctl
  namespace: gravitee
spec:
  selector:
    matchLabels:
      app: elasticsearch-sysctl
  template:
    metadata:
      labels:
        app: elasticsearch-sysctl
    spec:
      tolerations:
        - operator: Exists
      initContainers:
        - name: sysctl
          image: busybox:1.36
          command: ["sysctl", "-w", "vm.max_map_count=262144"]
          securityContext:
            privileged: true
      containers:
        - name: pause
          image: busybox:1.36
          command: ["sh", "-c", "sleep infinity"]
          resources:
            requests:
              cpu: 1m
              memory: 4Mi
MongoDB runs as a single standalone instance on a 10 GiB Block Storage volume:
kubectl create namespace gravitee --dry-run=client -o yaml | kubectl apply -f -
kubectl apply -f helm/gravitee/sysctl-daemonset.yaml
kubectl rollout status daemonset/elasticsearch-sysctl -n gravitee --timeout=3m

helm upgrade --install gravitee-mongodb bitnami/mongodb \
  --namespace gravitee \
  --set architecture=standalone \
  --set auth.enabled=false \
  --set persistence.enabled=true \
  --set persistence.storageClass=exoscale-sbs \
  --set persistence.size=10Gi \
  --set resources.requests.cpu=100m \
  --set resources.requests.memory=256Mi \
  --wait --timeout 10m
Elasticsearch uses the official Elastic chart, with a single node and a 20 GiB volume (helm/gravitee/elasticsearch-values.yaml):
replicas: 1
minimumMasterNodes: 1
esJavaOpts: "-Xmx512m -Xms512m"
antiAffinity: soft
clusterHealthCheckParams: "wait_for_status=yellow&timeout=1s"

# vm.max_map_count is already set by the sysctl DaemonSet
sysctlInitContainer:
  enabled: false

resources:
  requests:
    cpu: 250m
    memory: 1Gi
  limits:
    cpu: 1000m
    memory: 2Gi

volumeClaimTemplate:
  storageClassName: exoscale-sbs
  resources:
    requests:
      storage: 20Gi
helm upgrade --install gravitee-elasticsearch elastic/elasticsearch \
--namespace gravitee \
--version 7.17.3 \
--values helm/gravitee/elasticsearch-values.yaml \
--wait --timeout 10mCheck that both volumes were created:
kubectl get pvc -n gravitee
exo compute block-storage list --zone ch-gva-2image.repository. For anything beyond a demo, prefer the Exoscale DBaaS alternatives described above.Step 7: Deploy Gravitee APIM
All the Gravitee configuration lives in helm/gravitee/values.yaml. It disables the bundled subcharts, points every component to our MongoDB and Elasticsearch services, and tells the chart which hostname each component is published under.
Start by generating a bcrypt hash for the admin password instead of keeping the default one:
htpasswd -bnBC 10 "" 'choose-a-strong-password' | tr -d ':\n'# Admin password (bcrypt), generated with htpasswd
adminPasswordBcrypt: "$2y$10$REPLACE_WITH_YOUR_HASH"
# MongoDB and Elasticsearch are separate Helm releases
mongodb:
enabled: false
elasticsearch:
enabled: false
mongo:
rsEnabled: false
dbhost: gravitee-mongodb
dbport: 27017
dbname: graviteeio
es:
endpoints:
- http://elasticsearch-master:9200
index: gravitee
security:
enabled: false
# ── API Gateway: the data plane ──────────────────────────────
gateway:
replicaCount: 2
services:
metrics:
enabled: true
prometheus:
enabled: true
# No Ingress: routing is done by the HTTPRoutes of Step 8. The chart still
# reads these hosts and paths to build the public URLs it hands to browsers.
ingress:
enabled: false
hosts:
- gateway.example.com
path: /
resources:
requests: { cpu: 200m, memory: 512Mi }
limits: { cpu: 1000m, memory: 1Gi }
# ── Management API: the control plane ────────────────────────
api:
replicaCount: 1
services:
core:
http:
host: 0.0.0.0
metrics:
enabled: true
prometheus:
enabled: true
# Same host, two context paths: /management (Console) and /portal (Portal)
ingress:
management:
enabled: false
hosts:
- management-api.example.com
path: /management
portal:
enabled: false
hosts:
- management-api.example.com
path: /portal
# JVM + Spring + database connections: allow up to 10 minutes to start
startupProbe:
enabled: true
initialDelaySeconds: 30
periodSeconds: 10
failureThreshold: 60
timeoutSeconds: 5
# Do not start before MongoDB and Elasticsearch accept connections
initContainers:
- name: wait-mongodb
image: busybox:1.36
command: ["sh", "-c", "until nc -z gravitee-mongodb 27017; do echo waiting for mongodb; sleep 3; done"]
- name: wait-elasticsearch
image: busybox:1.36
command: ["sh", "-c", "until nc -z elasticsearch-master 9200; do echo waiting for elasticsearch; sleep 3; done"]
resources:
requests: { cpu: 200m, memory: 512Mi }
limits: { cpu: 500m, memory: 1Gi }
# ── Console UI ───────────────────────────────────────────────
ui:
replicaCount: 1
ingress:
enabled: false
hosts:
- console.example.com
path: /
resources:
requests: { cpu: 50m, memory: 64Mi }
limits: { cpu: 100m, memory: 128Mi }
# ── Developer Portal ─────────────────────────────────────────
portal:
replicaCount: 1
ingress:
enabled: false
hosts:
- devportal.example.com
path: /
resources:
requests: { cpu: 50m, memory: 64Mi }
limits: { cpu: 100m, memory: 128Mi }A few choices are worth highlighting:
- Every ingress is disabled, but the hosts stay. The Console and the Developer Portal are single-page apps: the browser downloads them, then calls the Management API directly. The chart builds those public URLs from
*.ingress.hostsand*.ingress.path, and it does so whether or notenabledis set, so keeping the hosts is enough. Leave them out and the Console ends up callinghttps://apim.example.com/management, the chart’s default. - Two gateway replicas: with the anti-affinity group, they run on nodes hosted on different hypervisors, so a single host failure does not interrupt API traffic.
- One hostname per component: simpler to reason about than path-based routing on a single host, and each component gets its own certificate and its own
Gatewaylistener. - Init containers and a generous startup probe on the Management API: on a fresh cluster, it would otherwise crash-loop while MongoDB and Elasticsearch are still initializing.
Install the chart:
helm upgrade --install gravitee-apim graviteeio/apim \
  --namespace gravitee \
  --version "4.6.0" \
  --values helm/gravitee/values.yaml \
--timeout 10m --waitallow-snippet-annotations on the controller, cluster-wide and for every tenant. And its nginx.ingress.kubernetes.io/rewrite-target: /$1 annotation, applied to the plain / paths used here, rewrites every URL to /: constants.json returns index.html, the Console stays blank, and you have to strip the annotation again after every helm upgrade. Neither annotation is created any more, and the HTTPRoutes of the next step carry no controller-specific configuration at all. That is the concrete payoff here: the routing is described once, in resources no controller can bend.Step 8: Expose Gravitee with HTTPRoutes
The last piece attaches each Gravitee Service to its listener on the Gateway. One HTTPRoute per component, all in the gravitee namespace (helm/gravitee/httproutes.yaml):
apiVersion: gateway.networking.k8s.io/v1
kind: HTTPRoute
metadata:
  name: gravitee-gateway
  namespace: gravitee
spec:
  parentRefs:
    - name: gravitee
      namespace: traefik
      sectionName: gateway-https
  hostnames:
    - gateway.example.com
  rules:
    - matches:
        - path:
            type: PathPrefix
            value: /
      backendRefs:
        - name: gravitee-apim-gateway
          port: 82
---
# The Management API already serves /management and /portal itself:
# the paths are matched, never rewritten.
apiVersion: gateway.networking.k8s.io/v1
kind: HTTPRoute
metadata:
  name: gravitee-management-api
  namespace: gravitee
spec:
  parentRefs:
    - name: gravitee
      namespace: traefik
      sectionName: management-api-https
  hostnames:
    - management-api.example.com
  rules:
    - matches:
        - path:
            type: PathPrefix
            value: /management
        - path:
            type: PathPrefix
            value: /portal
      backendRefs:
        - name: gravitee-apim-api
          port: 83
---
apiVersion: gateway.networking.k8s.io/v1
kind: HTTPRoute
metadata:
  name: gravitee-console
  namespace: gravitee
spec:
  parentRefs:
    - name: gravitee
      namespace: traefik
      sectionName: console-https
  hostnames:
    - console.example.com
  rules:
    - matches:
        - path:
            type: PathPrefix
            value: /
      backendRefs:
        - name: gravitee-apim-ui
          port: 8002
---
apiVersion: gateway.networking.k8s.io/v1
kind: HTTPRoute
metadata:
  name: gravitee-devportal
  namespace: gravitee
spec:
  parentRefs:
    - name: gravitee
      namespace: traefik
      sectionName: devportal-https
  hostnames:
    - devportal.example.com
  rules:
    - matches:
        - path:
            type: PathPrefix
            value: /
      backendRefs:
        - name: gravitee-apim-portal
          port: 8003
The sectionName pins each route to a single listener. Without it, a route would also attach to the plain-HTTP listener, and its precise hostname would win over the catch-all redirect of Step 5, silently serving the Console over HTTP.
The service names come from the release name, gravitee-apim, and the ports are the chart’s own: 82 for the gateway, 83 for the Management API, 8002 for the Console and 8003 for the Developer Portal. Check them with kubectl get svc -n gravitee if you use a different release name.
kubectl apply -f helm/gravitee/httproutes.yaml
kubectl get httproute -n gravitee
Each route reports whether the Gateway accepted it and whether its backend Service exists:
kubectl get httproute gravitee-gateway -n gravitee \
  -o jsonpath='{range .status.parents[*].conditions[*]}{.type}={.status}{"\n"}{end}'
# Accepted=True
# ResolvedRefs=True
ResolvedRefs=False means the Service is missing, usually because the route was applied before the Helm release finished. Re-check after the pods are Running; nothing needs to be re-applied.
Step 9: Check the deployment and publish the Petstore API
kubectl get pods -n gravitee
kubectl get httproute -n gravitee
kubectl get certificate -n traefik
All pods should be Running, all routes attached to the Gateway, and all certificates READY=True. You can then open:
https://console.example.comto manage your APIs. Log in asadminwith the password you hashed in Step 7.https://devportal.example.comto browse the Developer Portal.
To test the whole chain with a real API contract, we will publish the well-known Swagger Petstore behind the gateway and protect it with an API key.
Get the Petstore OpenAPI definition
The Petstore is described by a public Swagger 2.0 definition. Download it and have a quick look:
curl -s https://petstore.swagger.io/v2/swagger.json -o petstore.json
jq '{title: .info.title, host, basePath, paths: (.paths | keys)}' petstore.json
Two fields matter here: host (petstore.swagger.io) becomes the backend endpoint, and basePath (/v2) becomes the context path of the API on the gateway.
Import it into Gravitee
In the Console (labels may vary slightly between Gravitee versions):
- Go to APIs > Add API > Import an API definition, choose OpenAPI specification, and either upload
petstore.jsonor paste the URLhttps://petstore.swagger.io/v2/swagger.json. Gravitee creates the API with the context path/v2, the backendhttps://petstore.swagger.io/v2, and a documentation page generated from the spec. - In the API, open Consumers > Plans and add an API Key plan. Enable automatic validation of subscriptions, then publish the plan.
- Start the API and deploy it. The gateway picks up the definition from MongoDB within a few seconds.
- Publish the API so it becomes visible in the Developer Portal.
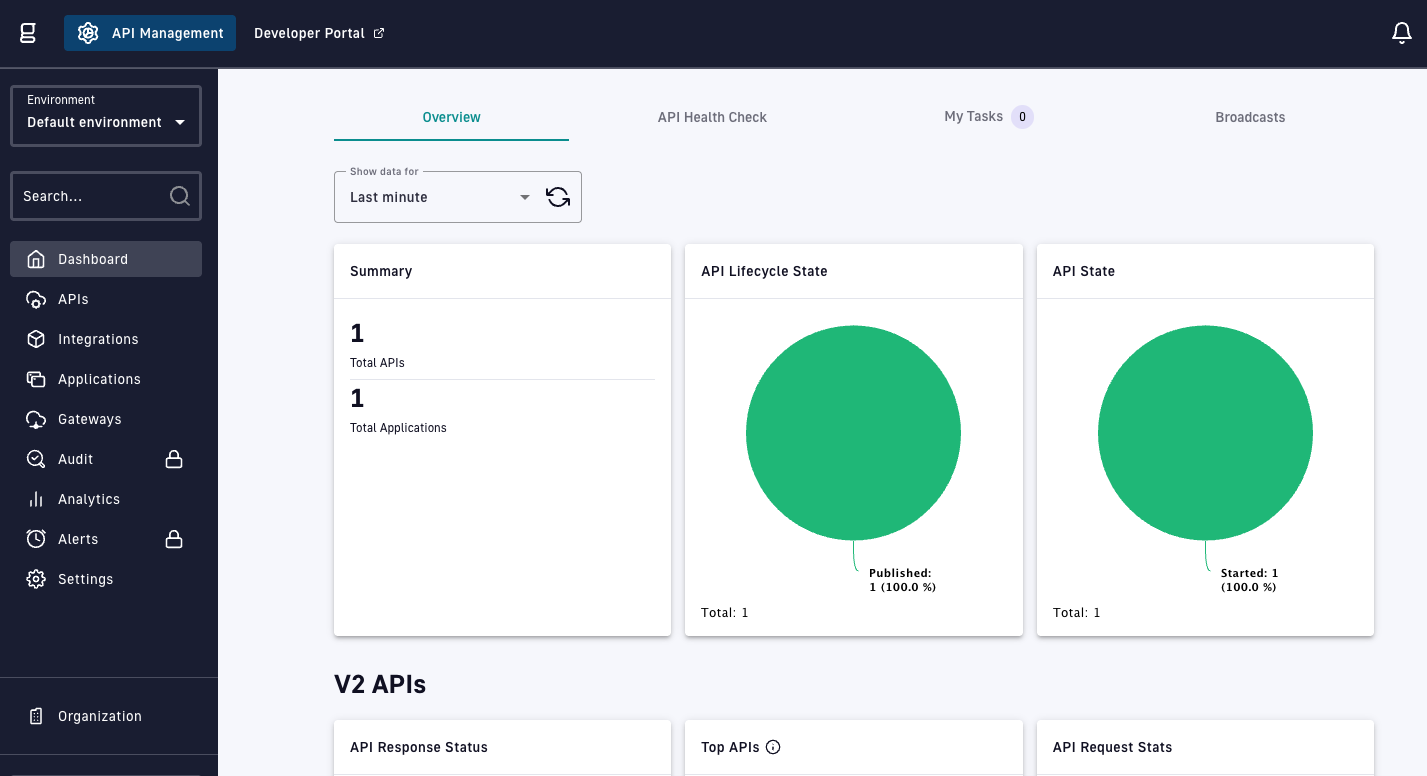
The Console dashboard now shows the Petstore API as published and started:
Subscribe and get an API key
API consumers need an application and a subscription to a plan. As an administrator, the quickest way is from the Console:
- Go to Applications > Add application and create a
petstore-clientapplication. - Back in the Petstore API, open Consumers > Subscriptions, create a subscription for
petstore-clientto the API Key plan, and copy the generated API key.
In real life, your API consumers do the same from the Developer Portal at https://devportal.example.com: they browse the catalog, read the documentation generated from the OpenAPI spec, and subscribe with their own application to get their key.
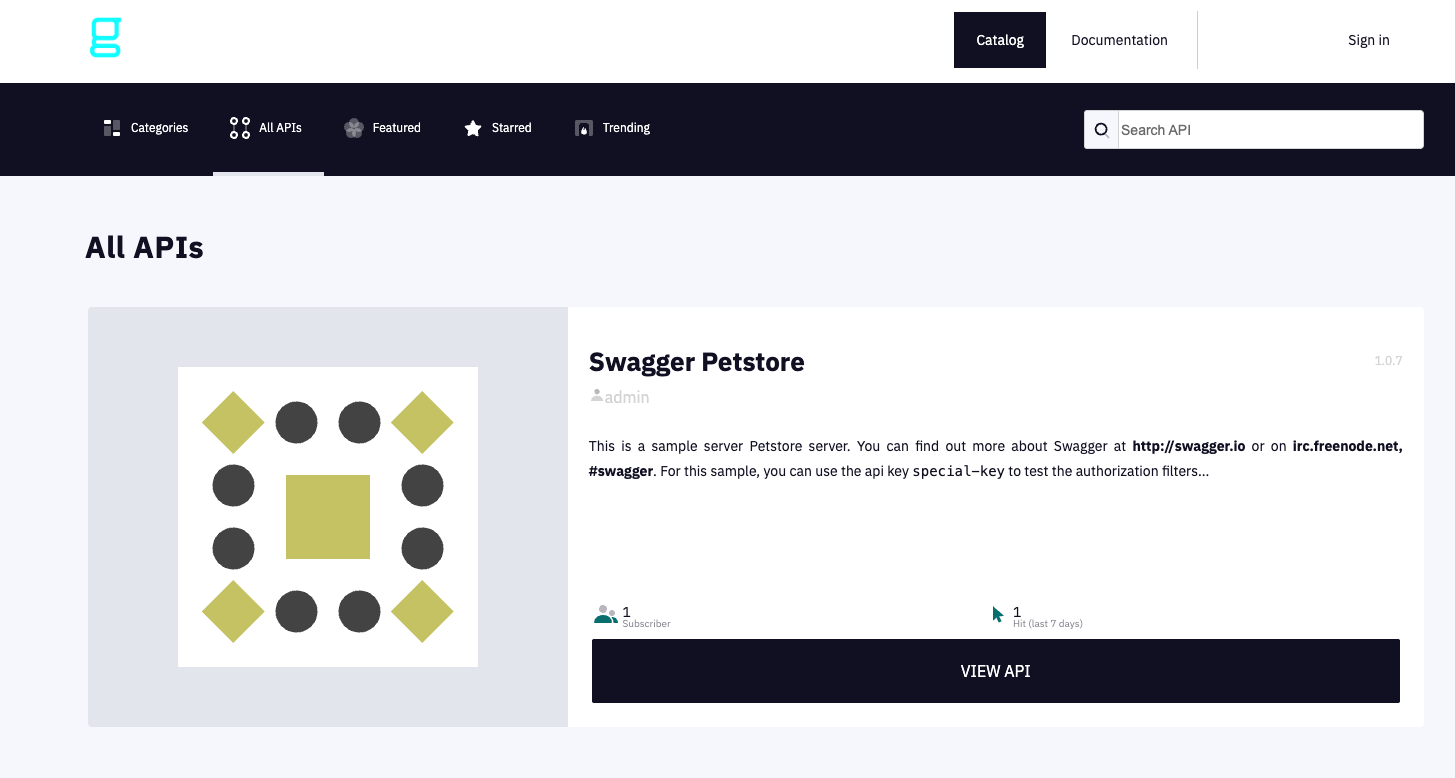
The special-key mentioned in the API description comes from the original Petstore spec and is meant for the backend. On the gateway, the key that counts is the Gravitee API key from your subscription.
Call the API through the gateway
Without a key, the gateway rejects the call before it ever reaches the backend:
curl -s -o /dev/null -w "%{http_code}\n" "https://gateway.example.com/v2/store/inventory"
# 401
With the key in the X-Gravitee-Api-Key header, the request goes through:
curl -s "https://gateway.example.com/v2/store/inventory" \
  -H 'accept: application/json' \
  -H 'X-Gravitee-Api-Key: <your-api-key>' | jq
{
"sold": 362,
"pending": 78,
"available": 66
}The public Petstore is shared by everyone, so your counts, and probably a few creative statuses, will differ. The request went through the Exoscale NLB, Traefik and the Gravitee gateway, which checked the API key, forwarded the call to https://petstore.swagger.io/v2/store/inventory and returned the response.
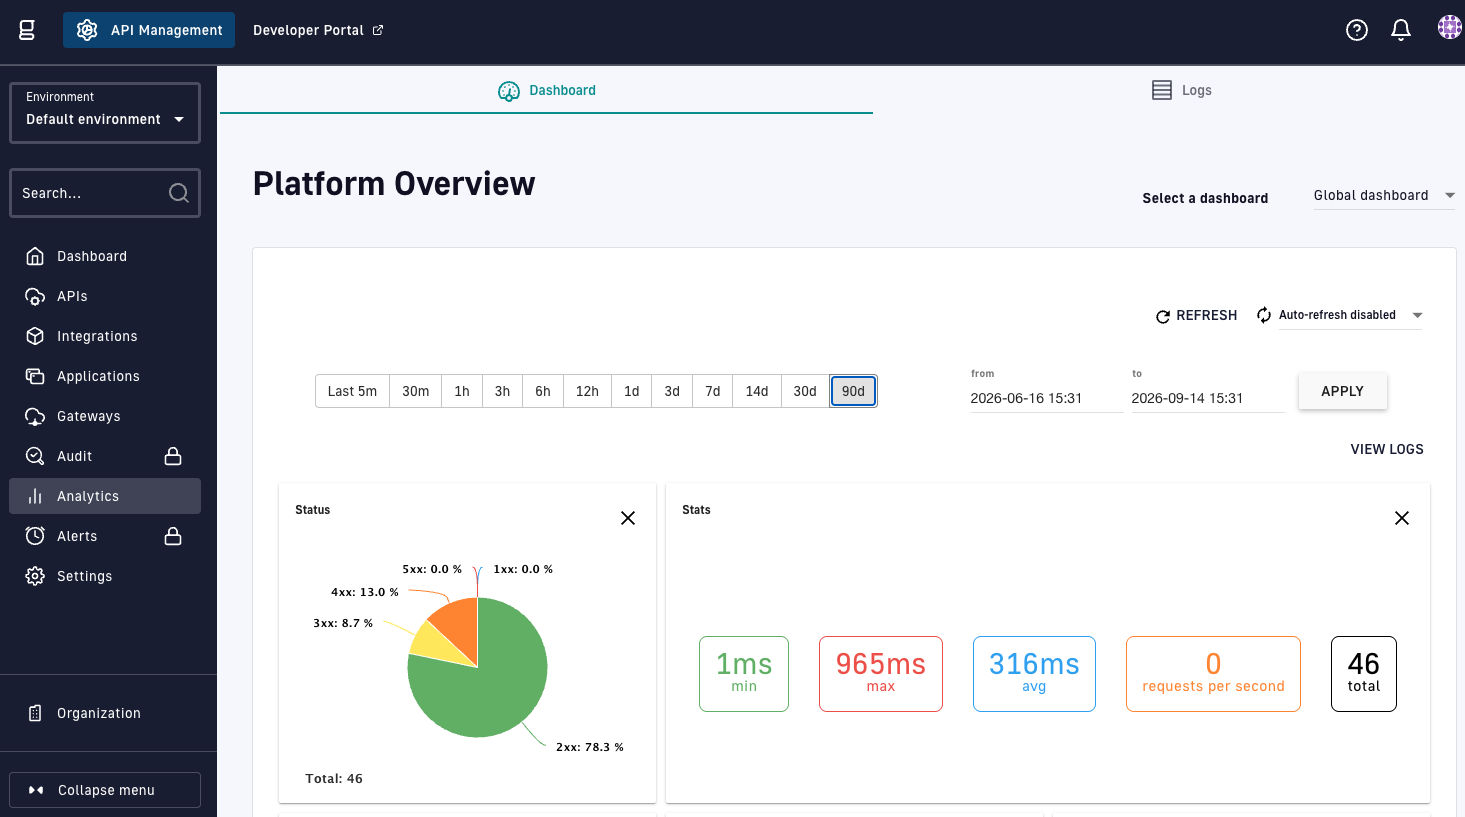
Every call is recorded in Elasticsearch. Open Analytics in the Console to see response times and status codes. The share of 4xx responses includes the calls rejected for a missing API key:
From here, try adding a rate-limiting policy to the plan and call the endpoint in a loop to watch the gateway return 429 Too Many Requests, or explore other endpoints such as /v2/pet/findByStatus?status=available.
The complete deployment script
Steps 2 to 8 are chained in scripts/deploy-gravitee.sh. It is idempotent (helm upgrade --install and kubectl apply everywhere), so you can re-run it after changing a value. Only two variables need to be set: your domain and the email address used for Let’s Encrypt. The hostnames in values.yaml, gateway.yaml and httproutes.yaml, and the issuer email, are substituted on the fly.
DOMAIN=example.com ACME_EMAIL=you@example.com ./scripts/deploy-gravitee.shscripts/deploy-gravitee.sh
#!/usr/bin/env bash
# Deploy Gravitee APIM (self-hosted) on Exoscale SKS, behind the Gateway API
#
# Prerequisites:
#   - Terraform infra applied (terraform/infra), including the NodePort rule
#     open to 0.0.0.0/0: the Exoscale NLB preserves source IPs, so Let's
#     Encrypt HTTP-01 challenges time out without it.
#   - kubectl, helm >= 3.10
#
# Usage: DOMAIN=example.com ACME_EMAIL=you@example.com ./scripts/deploy-gravitee.sh

set -euo pipefail

: "${DOMAIN:?Set DOMAIN, e.g. DOMAIN=example.com}"
: "${ACME_EMAIL:?Set ACME_EMAIL, e.g. ACME_EMAIL=you@example.com}"

export KUBECONFIG="${KUBECONFIG:-$(pwd)/terraform/infra/kubeconfig}"
NAMESPACE="gravitee"
RELEASE_NAME="gravitee-apim"
HELM_DIR="$(dirname "$0")/../helm/gravitee"
HOSTS=(gateway management-api console devportal)
GATEWAY_API_VERSION="v1.6.1"

log() { echo "[$(date +%H:%M:%S)] $*"; }

# ─────────────────────────────────────────────
# 1. Helm repositories
# ─────────────────────────────────────────────
log "Adding Helm repositories..."
helm repo add --force-update graviteeio https://helm.gravitee.io
helm repo add --force-update traefik    https://traefik.github.io/charts
helm repo add --force-update jetstack   https://charts.jetstack.io
helm repo add --force-update bitnami    https://charts.bitnami.com/bitnami
helm repo add --force-update elastic    https://helm.elastic.co
helm repo update

# ─────────────────────────────────────────────
# 2. Gateway API CRDs, then Traefik. Its
#    LoadBalancer Service makes the Exoscale
#    CCM create the NLB.
# ─────────────────────────────────────────────
log "Installing the Gateway API CRDs (standard channel)..."
kubectl apply -f "https://github.com/kubernetes-sigs/gateway-api/releases/download/${GATEWAY_API_VERSION}/standard-install.yaml"

log "Installing Traefik as the Gateway API controller..."
helm upgrade --install traefik traefik/traefik \
  --namespace traefik --create-namespace \
  --version "41.5.0" \
  --set providers.kubernetesGateway.enabled=true \
  --set providers.kubernetesIngress.enabled=false \
  --set gateway.enabled=false \
  --set service.annotations."service\.beta\.kubernetes\.io/exoscale-loadbalancer-name"="gravitee-nlb" \
  --set service.annotations."service\.beta\.kubernetes\.io/exoscale-loadbalancer-service-healthcheck-interval"="10s" \
  --set service.annotations."service\.beta\.kubernetes\.io/exoscale-loadbalancer-service-healthcheck-timeout"="5s" \
  --set service.annotations."service\.beta\.kubernetes\.io/exoscale-loadbalancer-service-healthcheck-strikes-ok"="2" \
  --set service.annotations."service\.beta\.kubernetes\.io/exoscale-loadbalancer-service-healthcheck-strikes-fail"="3" \
  --wait

# ─────────────────────────────────────────────
# 3. cert-manager + Let's Encrypt ClusterIssuer.
#    The Gateway API CRDs must already be there:
#    cert-manager only checks them at startup.
# ─────────────────────────────────────────────
log "Installing cert-manager (with Gateway API support)..."
helm upgrade --install cert-manager jetstack/cert-manager \
  --namespace cert-manager --create-namespace \
  --version "v1.21.2" \
  --set crds.enabled=true \
  --set config.enableGatewayAPI=true \
  --wait
kubectl rollout status deployment/cert-manager-webhook -n cert-manager --timeout=120s

log "Applying ClusterIssuer (Let's Encrypt production)..."
sed "s/you@example.com/${ACME_EMAIL}/" "$HELM_DIR/cert-manager-issuer.yaml" | kubectl apply -f -

# ─────────────────────────────────────────────
# 4. NLB IP and DNS records
# ─────────────────────────────────────────────
log "Waiting for the NLB IP (up to 3 minutes)..."
NLB_IP=""
for _ in $(seq 1 18); do
  NLB_IP=$(kubectl get svc traefik -n traefik \
    -o jsonpath='{.status.loadBalancer.ingress[0].ip}' 2>/dev/null || true)
  [[ -n "$NLB_IP" ]] && break
  sleep 10
done

if [[ -n "$NLB_IP" ]]; then
  log "NLB IP: $NLB_IP. Create these DNS A records before continuing:"
  for h in "${HOSTS[@]}"; do printf "    %-40s -> %s\n" "$h.$DOMAIN" "$NLB_IP"; done
else
  log "WARNING: could not get the NLB IP automatically, check the Traefik Service."
fi
read -rp "  Press ENTER once DNS records are propagated, or Ctrl+C to abort..."

# ─────────────────────────────────────────────
# 5. Gateway: one HTTP listener for ACME and the
#    HTTPS redirect, one HTTPS listener per host.
#    cert-manager issues one certificate each.
# ─────────────────────────────────────────────
log "Applying the Gateway and its HTTPS redirect..."
sed "s/example\.com/${DOMAIN}/g" "$HELM_DIR/gateway.yaml" | kubectl apply -f -

log "Waiting for the Let's Encrypt certificates (up to 5 minutes)..."
# cert-manager needs a moment to turn the Gateway listeners into Certificates,
# and "kubectl wait --all" fails outright when nothing matches yet.
for _ in $(seq 1 12); do
  [[ -n "$(kubectl get certificate -n traefik -o name 2>/dev/null)" ]] && break
  sleep 5
done
kubectl wait --for=condition=Ready certificate -n traefik --all --timeout=5m || \
  log "WARNING: some certificates are not ready, check 'kubectl describe challenge -n traefik'."

# ─────────────────────────────────────────────
# 6. MongoDB + Elasticsearch (separate releases)
# ─────────────────────────────────────────────
kubectl create namespace "$NAMESPACE" --dry-run=client -o yaml | kubectl apply -f -

log "Applying sysctl DaemonSet (vm.max_map_count for Elasticsearch)..."
kubectl apply -f "$HELM_DIR/sysctl-daemonset.yaml"
kubectl rollout status daemonset/elasticsearch-sysctl -n "$NAMESPACE" --timeout=3m

log "Installing MongoDB..."
helm upgrade --install gravitee-mongodb bitnami/mongodb \
  --namespace "$NAMESPACE" \
  --set architecture=standalone \
  --set auth.enabled=false \
  --set persistence.enabled=true \
  --set persistence.storageClass=exoscale-sbs \
  --set persistence.size=10Gi \
  --set resources.requests.cpu=100m \
  --set resources.requests.memory=256Mi \
  --wait --timeout 10m

log "Installing Elasticsearch..."
# The official Elastic chart names its service "elasticsearch-master"
helm upgrade --install gravitee-elasticsearch elastic/elasticsearch \
  --namespace "$NAMESPACE" \
  --version 7.17.3 \
  --values "$HELM_DIR/elasticsearch-values.yaml" \
  --wait --timeout 10m

# ─────────────────────────────────────────────
# 7. Gravitee APIM. Every ingress is disabled:
#    the chart only uses the hosts to build the
#    public URLs it serves to the browser.
# ─────────────────────────────────────────────
log "Installing Gravitee APIM..."
sed "s/example\.com/${DOMAIN}/g" "$HELM_DIR/values.yaml" | \
  helm upgrade --install "$RELEASE_NAME" graviteeio/apim \
    --namespace "$NAMESPACE" \
    --version "4.6.0" \
    --values - \
    --timeout 10m --wait

# ─────────────────────────────────────────────
# 8. HTTPRoutes: attach each Gravitee Service to
#    its listener on the Gateway.
# ─────────────────────────────────────────────
log "Applying the HTTPRoutes..."
sed "s/example\.com/${DOMAIN}/g" "$HELM_DIR/httproutes.yaml" | kubectl apply -f -

# ─────────────────────────────────────────────
# 9. Summary
# ─────────────────────────────────────────────
kubectl get pods -n "$NAMESPACE"
kubectl get httproute -n "$NAMESPACE"
cat <<EOF

  Gravitee APIM is up:
    Gateway           https://gateway.$DOMAIN
    Management API    https://management-api.$DOMAIN
    Console           https://console.$DOMAIN
    Developer Portal  https://devportal.$DOMAIN

  Log in to the Console as "admin" with the password hashed in values.yaml.
EOF
Going to production
This setup is a solid starting point, but a production API platform deserves a few upgrades:
- Move the data layer out of the cluster. Stateful services are the hardest part to operate. As explained in Step 6, replace MongoDB with Exoscale Managed PostgreSQL through Gravitee’s JDBC repository, and Elasticsearch with Exoscale Managed OpenSearch. Both are part of Exoscale DBaaS, with backups, high availability and upgrades handled for you.
- Enable authentication everywhere. Turn on MongoDB authentication and Elasticsearch security (or use DBaaS, where it is on by default), and keep credentials in Kubernetes Secrets fed by a secret manager rather than in
values.yaml. - Restrict the control plane. The Console and the Management API do not need to be reachable from the whole internet. Because the Exoscale NLB preserves source IPs, set
service.externalTrafficPolicy=Localon the Traefik Service so the real client IP reaches Traefik rather than a node address, then attach a TraefikipAllowListMiddleware to the Console and Management API routes with anExtensionReffilter. Filters like this are the Gateway API’s answer to controller-specific annotations: they stay in the route, and swapping controllers only means swapping the referenced resource. You can also expose the control plane only through a VPN. - Scale the gateway. Enable
gateway.autoscaling(a HorizontalPodAutoscaler), add a PodDisruptionBudget, and size the node pool for peak traffic. The node pool behind the NLB can be scaled at any time with Terraform orexo compute sks nodepool scale. - Observe it. The gateway exposes Prometheus metrics, which you can send to Exoscale Managed Thanos and view in Exoscale Managed Grafana next to your cluster metrics (see below).
- Keep versions moving. The chart and CRD versions above are pinned for reproducibility. Bump them regularly, and follow the Gateway API releases: the core resources are stable, but controllers adopt the newer channels at their own pace, so check Traefik’s support matrix before upgrading the CRDs.
Observability with Exoscale Thanos and Grafana
Gravitee’s analytics in Elasticsearch tell you how your APIs behave. To also watch the platform itself (gateway JVMs, pods, nodes), the gateway exposes Prometheus metrics on its technical port 18082, at /_node/metrics/prometheus. This is enabled by gateway.services.metrics.prometheus.enabled: true in our values.yaml.
Rather than running Prometheus storage and Grafana inside the cluster, you can hand them over to Exoscale managed services:
    flowchart LR
  subgraph SKS["SKS cluster"]
    AG["Prometheus Agent"]
    GW["Gravitee Gateway<br/>:18082"]
    K8S["kube-state-metrics<br/>node-exporter"]
    AG -- scrape --> GW
    AG -- scrape --> K8S
  end
  AG -- remote write --> TH[("Exoscale<br/>Managed Thanos")]
  GR["Exoscale<br/>Managed Grafana"] -- query --> TH
- A lightweight Prometheus Agent runs in the cluster. It scrapes the Gravitee and Kubernetes metrics, keeps no local storage, and remote-writes everything to Thanos.
- Exoscale Managed Thanos stores the metrics for the long term and handles retention and downsampling.
- Exoscale Managed Grafana uses Thanos as a Prometheus data source, so a single Grafana shows cluster metrics and application metrics side by side.
1. Create the managed services in the same zone as the cluster:
exo dbaas create thanos startup-4 gravitee-thanos --zone ch-gva-2
exo dbaas create grafana hobbyist-2 gravitee-grafana --zone ch-gva-2
Then set their IP filters, with the --thanos-ip-filter and --grafana-ip-filter flags or in the Portal. Thanos must accept the public IPs of your SKS nodes (see kubectl get nodes -o wide), and Grafana your own IP.
2. Deploy the Prometheus Operator and Agent by following Deploy Prometheus to Thanos. Make two adjustments to the PrometheusAgent of that guide:
- add
serviceMonitorNamespaceSelector: {}to its spec. By default, the agent only picks up ServiceMonitors from its ownmonitoringnamespace, not fromgravitee. - the guide’s
writeRelabelConfigsonly forwards theup,process_*andgo_*series. Remove it, or extend its regex to the metrics you want in Thanos.
3. Let the agent scrape the gateway. The chart does not create a Service for the technical port, so we add one, along with the credentials of the technical API and a ServiceMonitor:
apiVersion: v1
kind: Service
metadata:
  name: gravitee-apim-gateway-technical
  namespace: gravitee
  labels:
    app.kubernetes.io/component: gateway
    app.kubernetes.io/instance: gravitee-apim
    app.kubernetes.io/name: apim
spec:
  type: ClusterIP
  selector:
    app.kubernetes.io/component: gateway
    app.kubernetes.io/instance: gravitee-apim
    app.kubernetes.io/name: apim
  ports:
    - name: technical
      port: 18082
      targetPort: 18082
---
apiVersion: monitoring.coreos.com/v1
kind: ServiceMonitor
metadata:
  name: gravitee-gateway
  namespace: gravitee
spec:
  selector:
    matchLabels:
      app.kubernetes.io/component: gateway
      app.kubernetes.io/instance: gravitee-apim
      app.kubernetes.io/name: apim
  endpoints:
    - port: technical
      path: /_node/metrics/prometheus
      interval: 30s
      basicAuth:
        username:
          name: gravitee-technical-api-auth
          key: username
        password:
          name: gravitee-technical-api-auth
          key: password
kubectl create secret generic gravitee-technical-api-auth -n gravitee \
--from-literal=username=admin \
--from-literal=password='<technical-api-password>'The technical API password defaults to adminadmin in the Gravitee chart. Change it with gateway.services.core.http.authentication.password, and keep the Secret in sync.
4. Add cluster metrics with kube-state-metrics (the state of Kubernetes objects) and node-exporter (node CPU, memory, disk and network). Both charts create their own ServiceMonitor:
helm repo add prometheus-community https://prometheus-community.github.io/helm-charts
helm upgrade --install kube-state-metrics prometheus-community/kube-state-metrics \
  -n monitoring --set prometheus.monitor.enabled=true
helm upgrade --install node-exporter prometheus-community/prometheus-node-exporter \
  -n monitoring --set prometheus.monitor.enabled=true
node-exporter listens on port 9100 of each node’s host network, so allow it between nodes in the security group. With the Terraform code of Step 1, that is one more entry in node_to_node_rules:
node_exporter = { protocol = "TCP", port = 9100, description = "node-exporter" }5. Connect Grafana to Thanos by following Integrate Grafana: add a Prometheus data source pointing to the Thanos query endpoint. You can then build dashboards that show cluster health (nodes, pods, restarts) next to gateway metrics (JVM memory, HTTP requests, latency), all from one managed Grafana.
Cleaning up
The NLB and the Block Storage volumes were created by Kubernetes, not by Terraform. Delete them from Kubernetes before destroying the cluster, otherwise they are left behind:
helm uninstall gravitee-apim gravitee-elasticsearch gravitee-mongodb -n gravitee
kubectl delete namespace gravitee        # releases the PVCs and their Block Storage volumes
kubectl delete -f helm/gravitee/gateway.yaml    # Gateway and its HTTPS redirect route
helm uninstall traefik -n traefik        # deletes the NLB
cd terraform/infra && terraform destroy
Also remember to delete the DNS records.
Conclusion
In about twenty minutes and a few hundred lines of Terraform, YAML and Bash, we deployed a complete, TLS-secured API Management platform on Exoscale: a highly available gateway, a management console, a developer portal and API analytics, all running in a Swiss data center.
Most of the heavy lifting is done by SKS integrations: a LoadBalancer Service becomes an Exoscale NLB, and a PVC becomes a Block Storage volume. The main Exoscale-specific detail to remember is that the NLB preserves client IPs, so the node security group must let client traffic reach the NodePorts: the whole internet for a test, only known public IPs in production.
Routing everything through the Gateway API rather than an Ingress controller costs one extra resource, the Gateway, and pays for itself immediately: no retired dependency at the front door, no controller-specific annotations in the application’s manifests, and a clean split between the entry point the platform owns and the routes the APIM owns.
From here, you can plug your own backends behind the gateway, invite API consumers to the Developer Portal, and progressively move the data layer to Exoscale managed databases. Your APIs stay governed, observable and sovereign.