Kubernetes Audit Log available on Exoscale SKS
 Luc Juggery
The Kubernetes API Server has many configuration options. We use some to configure the audit logs feature, allowing the API Server to log specific incoming requests.
Exoscale has recently enabled the Audit Logs capability of its Managed Kubernetes offering. It allows you to configure the cluster’s API Server to send the access logs to a webhook endpoint of your choice. This feature is available at other cloud providers, but it often sends logs to one of the provider’s managed services.
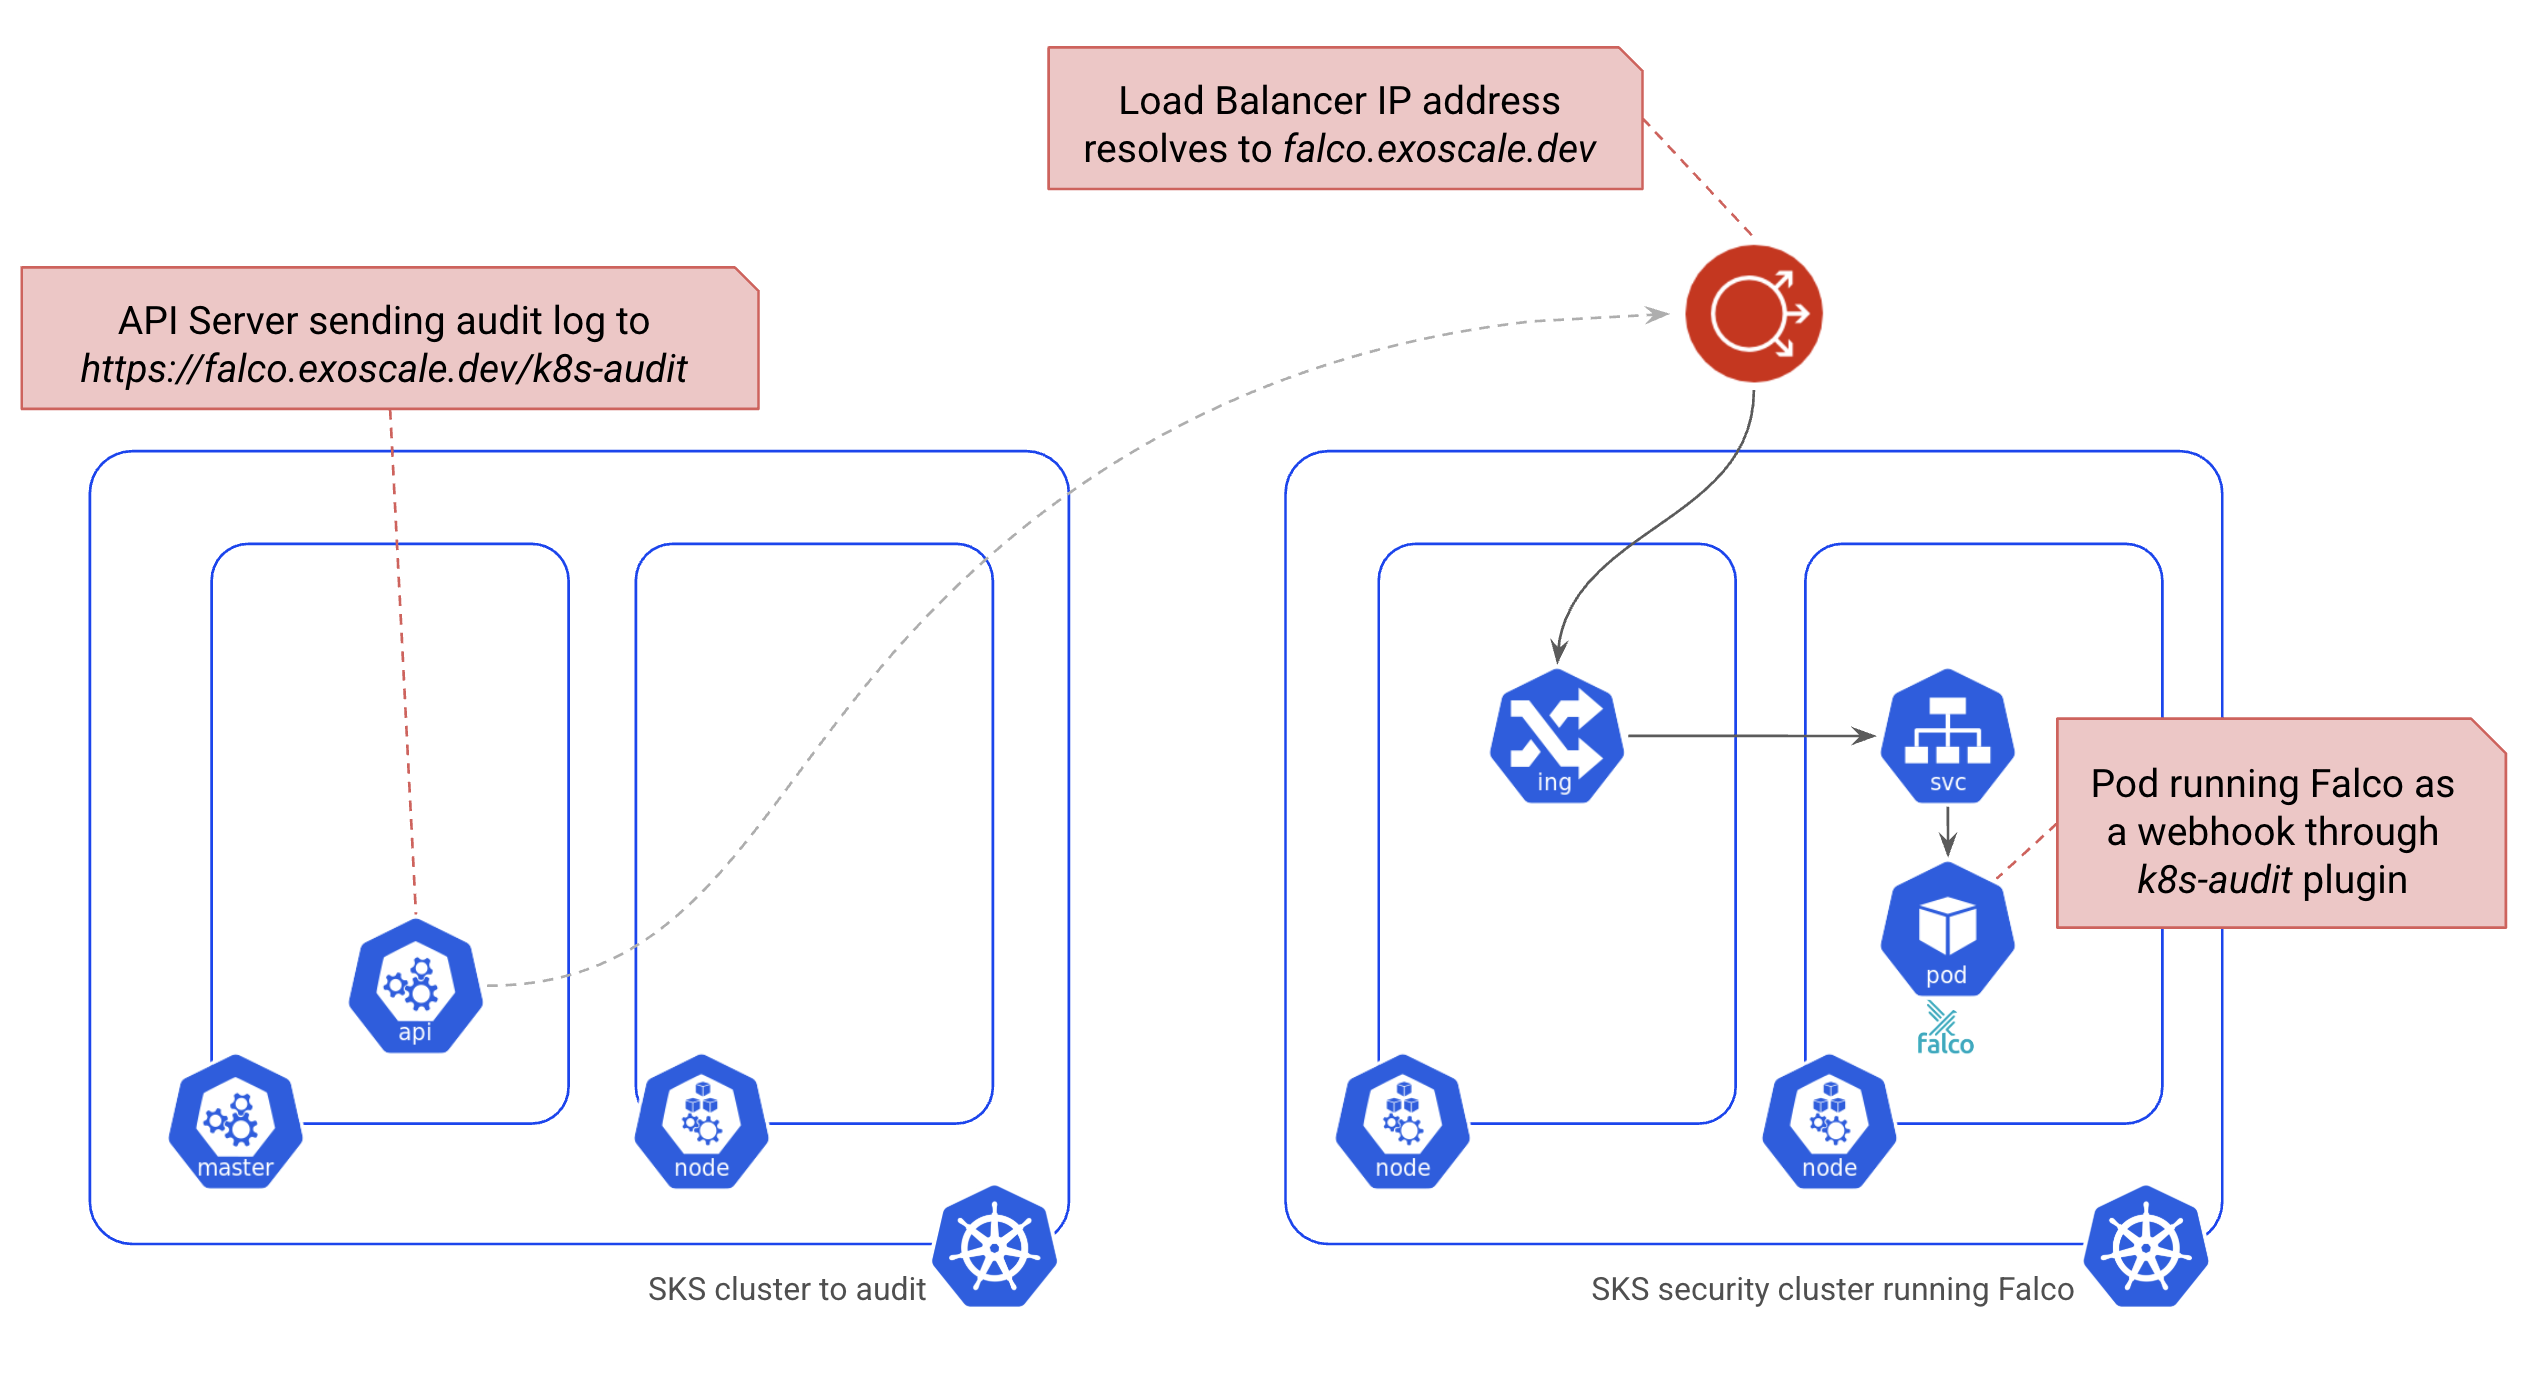
In this article, we’ll set up a dedicated cluster running Falco and send the audit logs of a demo cluster to it. The following schema gives an overview of the architecture we’ll use.
What are Audit Logs in Kubernetes?
From the official documentation, the audit logs allow answering the following questions.
- What happened?
- When did it happen?
- Who initiated it?
- On what did it happen?
- Where was it observed?
- From where was it initiated?
- To where was it going?
The API Server provides various flags to configure how and where to ship these logs. It can send them to a logging backend or a webhook endpoint, either individually or in batches. In this article, we’ll use the webhook approach, which is available in Exoscale SKS and is the most scalable in a production environment.
Below is the list of flags we use to configure sending audit logs to a webhook endpoint. The documentation provides the details of each one.
- –audit-webhook-config-file
- –audit-webhook-initial-backoff
- –audit-webhook-mode
- –audit-webhook-batch-buffer-size
- –audit-webhook-batch-max-size
- –audit-webhook-batch-max-wait
- –audit-webhook-batch-throttle-enable
- –audit-webhook-batch-throttle-qps
- –audit-webhook-batch-throttle-burst
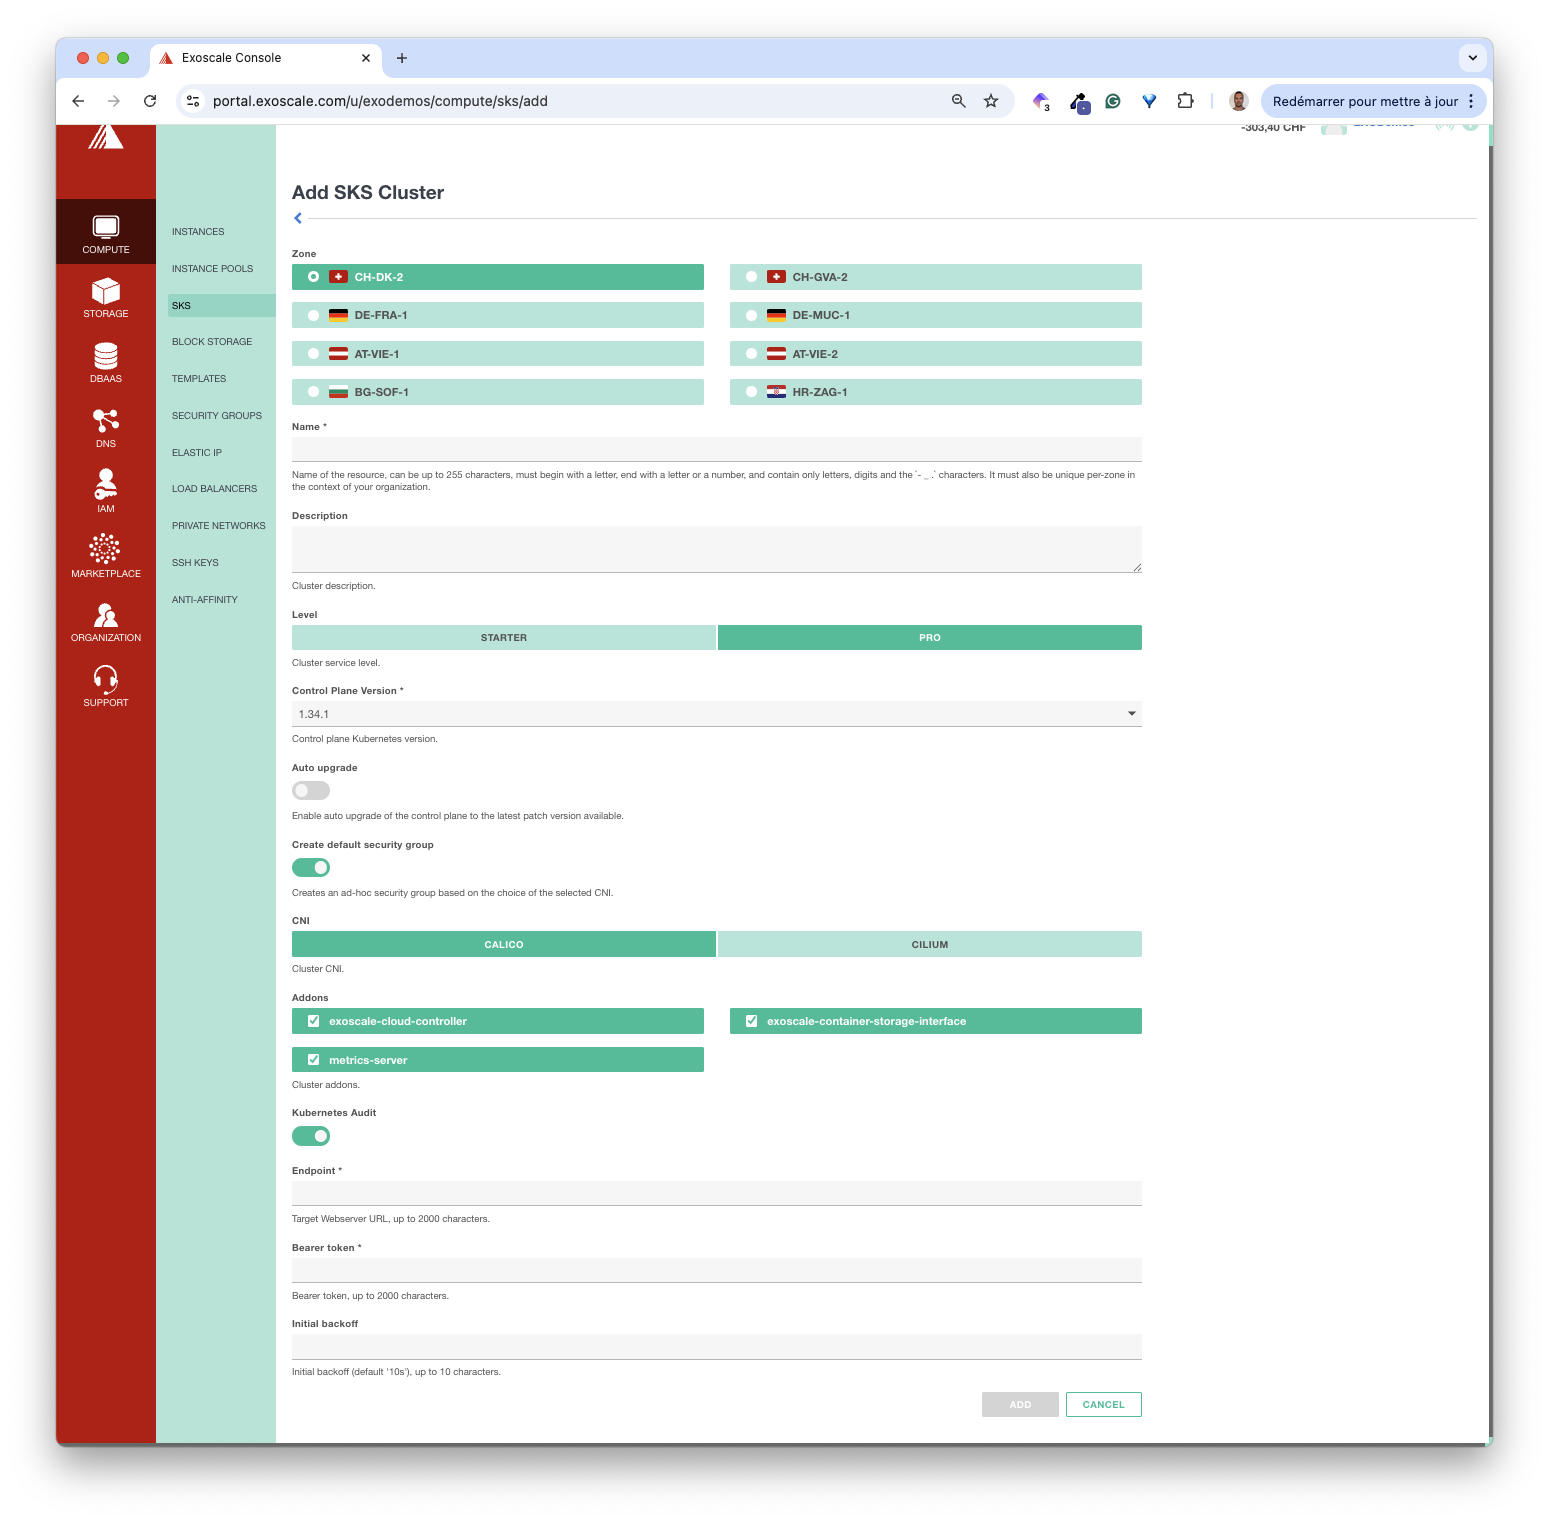
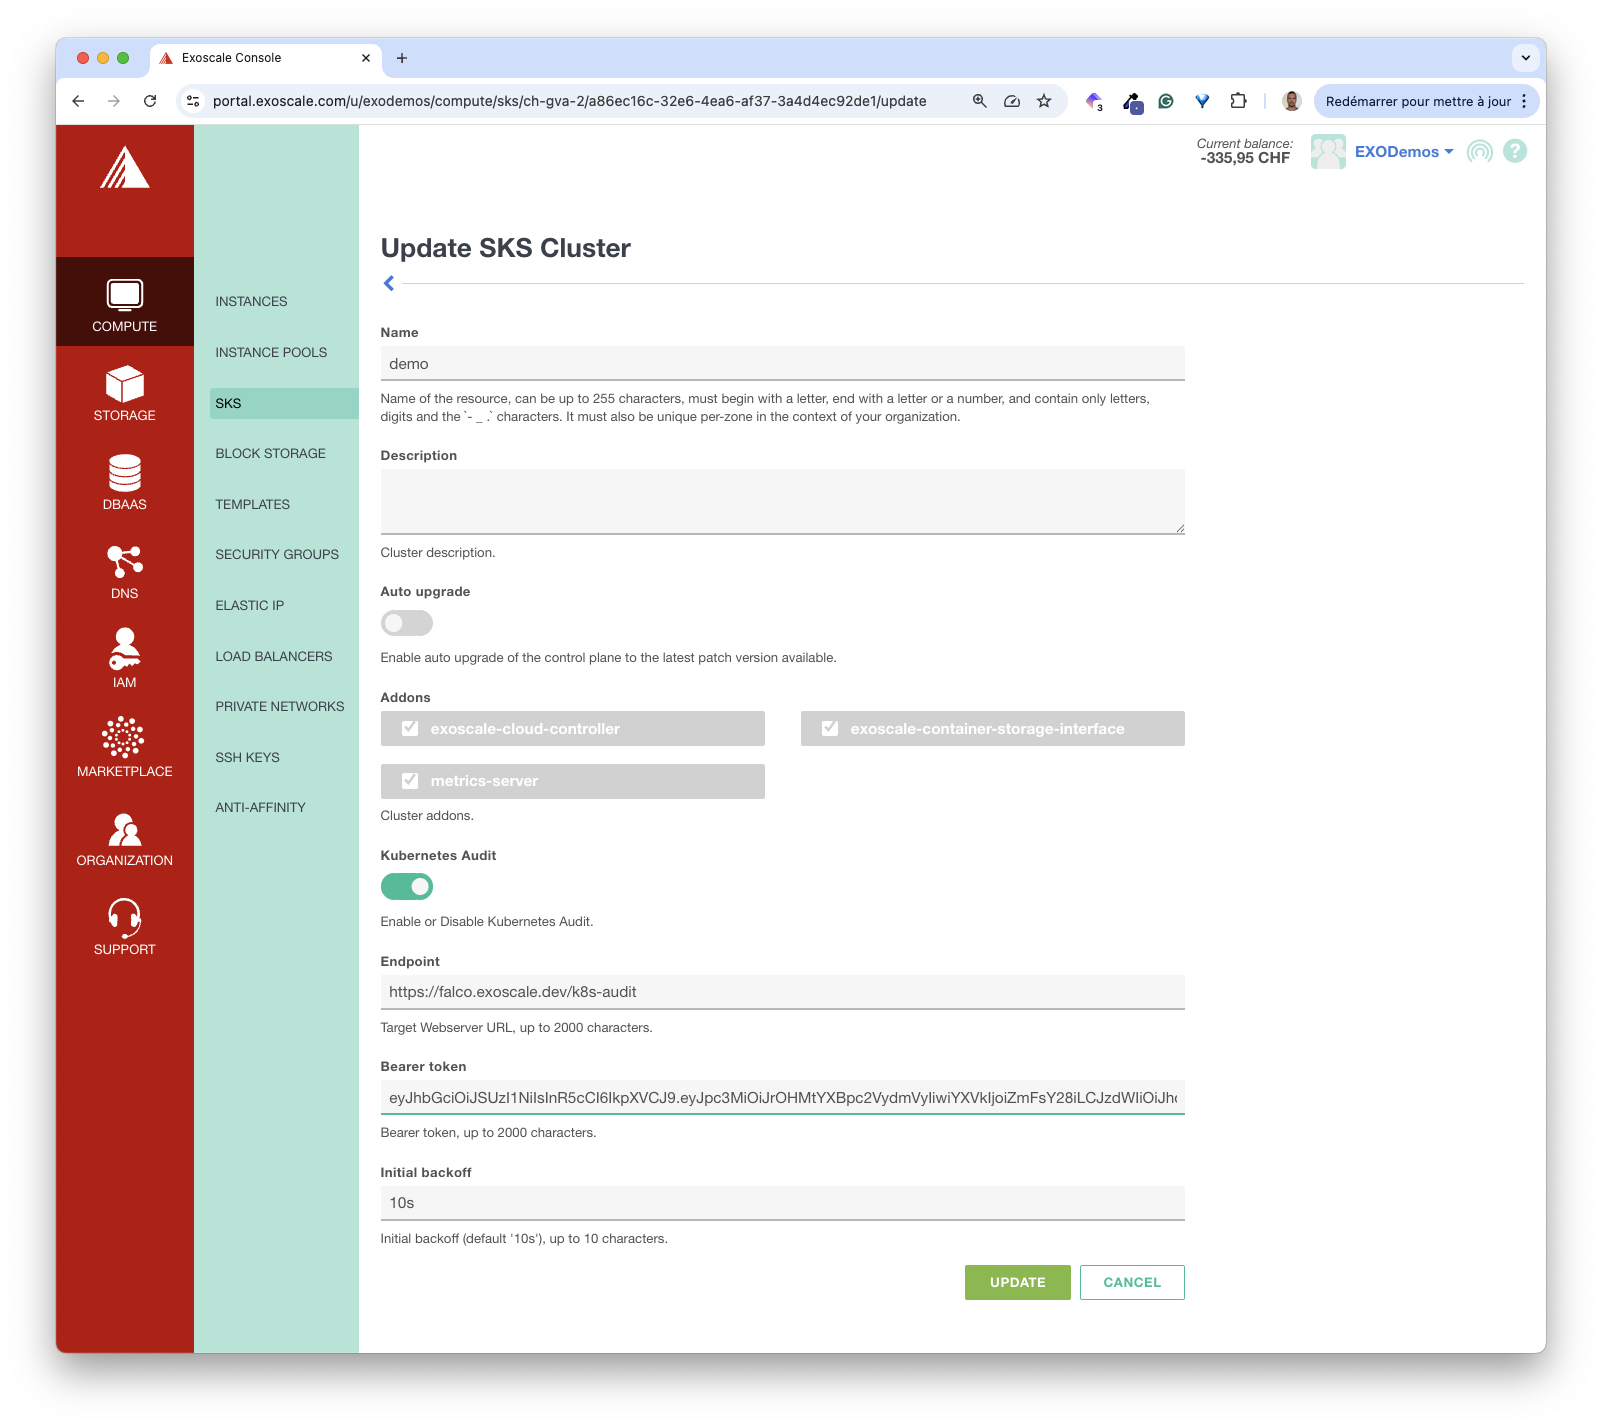
To keep it simple for end users, the current version of SKS internally uses the default values for most of these flags and allows users to specify the following values.
- endpoint: HTTP POST webhook endpoint to ship the logs to
- bearer token: token to authenticate against the webhook
- initial backoff: time to wait before retrying after the first failed attempt
The screenshot below shows these fields in the portal. We can set them when creating or updating the cluster. It means the audit logs feature can be disabled when creating a cluster and enabled later on.
Using the above flags, we can only specify how the logs are shipped. To determine which logs are shipped, the API Server relies on the --audit-policy-file flag, which expects a file containing a Policy resource specification. A Policy includes a list of rules, each of which defines which actions to log and which log level to use. The log level can be among the following values.
- None: it does not generate logs for the specified resources
- Metadata: it only logs the request’s metadata
- Request: it logs the complete request
- RequestResponse: it logs the request and its response
SKS uses the Policy defined in Falco’s k8saudit plugin. For example, the rule below logs the Metadata associated with requests on Secret resources.
 - level: Metadata
    resources:
    - group: "" # core API group
      resources: ["secrets"]
In the next section, we’ll set up a dedicated cluster to handle these logs.
Creation of the Falco cluster
In this section, we’ll walk through all the steps to configure an SKS cluster running Falco as a webhook receiver. We’ll make sure to install all the components needed to secure this webhook so it’s accessible over a secure, authenticated, and TLS-encrypted connection.
About Falco
The following gives an overview of Falco, a security tool that provides runtime security across hosts, containers, Kubernetes, and cloud environments.
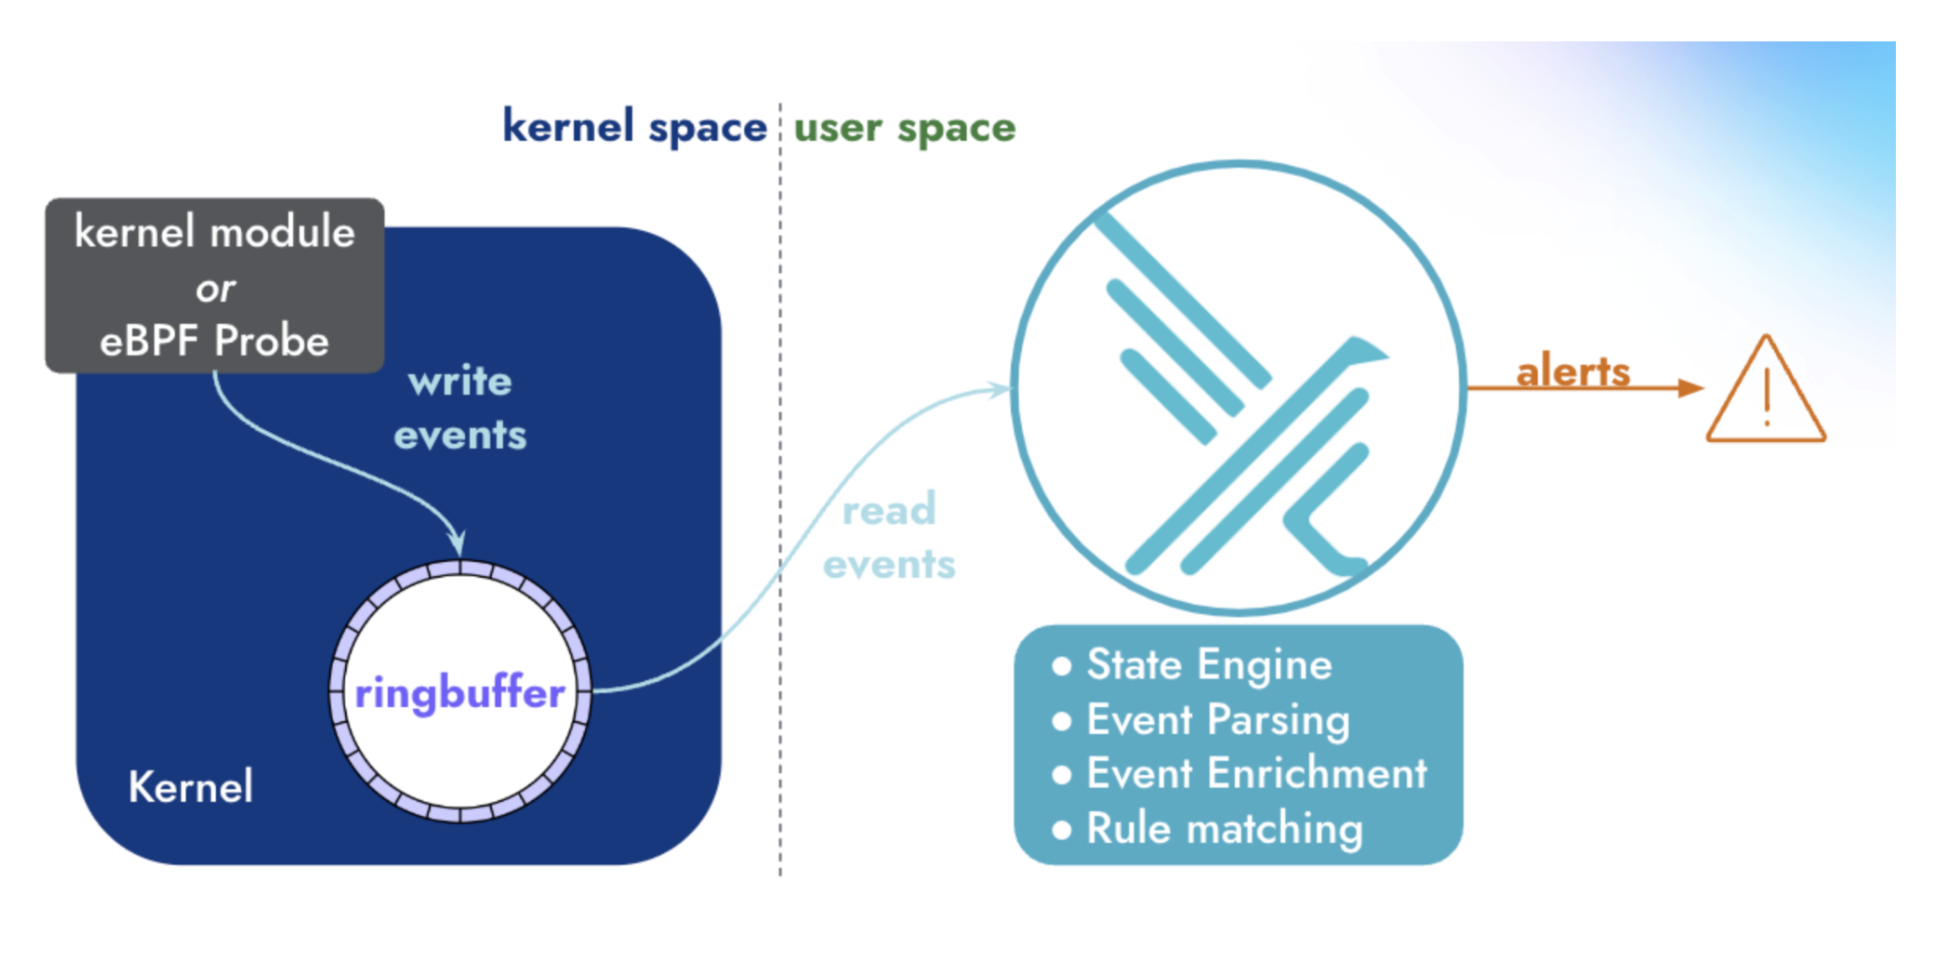
Falco is a rule engine that enables the detection of abnormal behavior, potential security threats, and compliance violations in a container, including:
- execution of a shell
- host’s volume mounted
- installation of a package
- launch of a new process
- port opening
- creation of a privileged container
Falco comes with a set of predefined rules and allows adding custom rules too. Falco generates an event (Notice, Warning, …) each time an audit log matches one of the rules.
Falco is primarily used to detect events with eBPF, but we can also configure it to send webhooks via a plugin. It’s the configuration we’ll use in this article.
Creating an SKS cluster
First, we create an SKS cluster. It can be done through the Exoscale portal, using the Terraform provider, the Pulumi provider, or the CLI. To keep it simple, we use the portal in this demo.

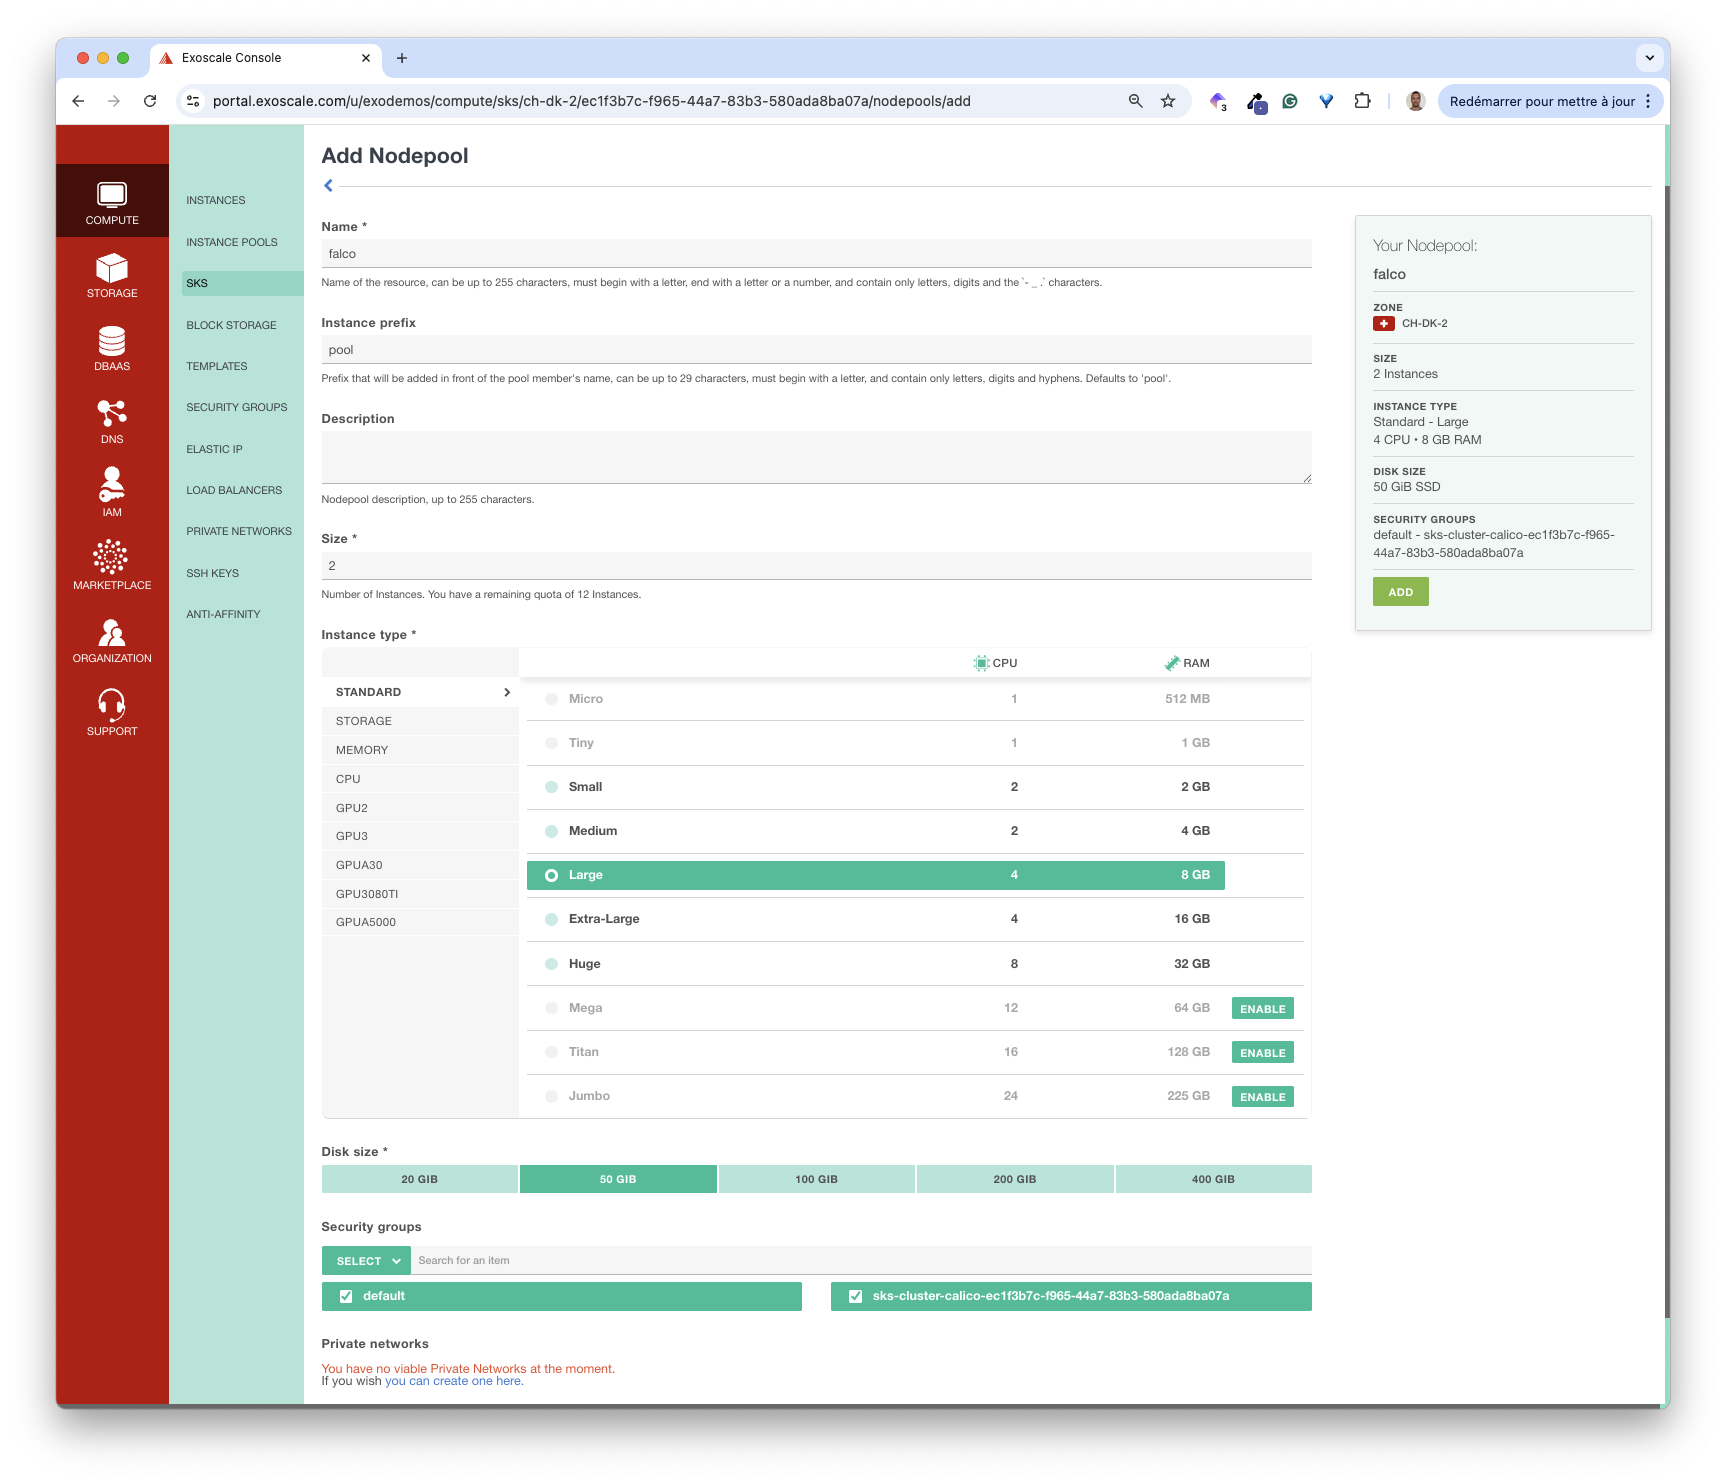
Next, we add a NodePool to the cluster. We name it falco, and add two instances of type Large.
It does not take long for the cluster to be up and ready.
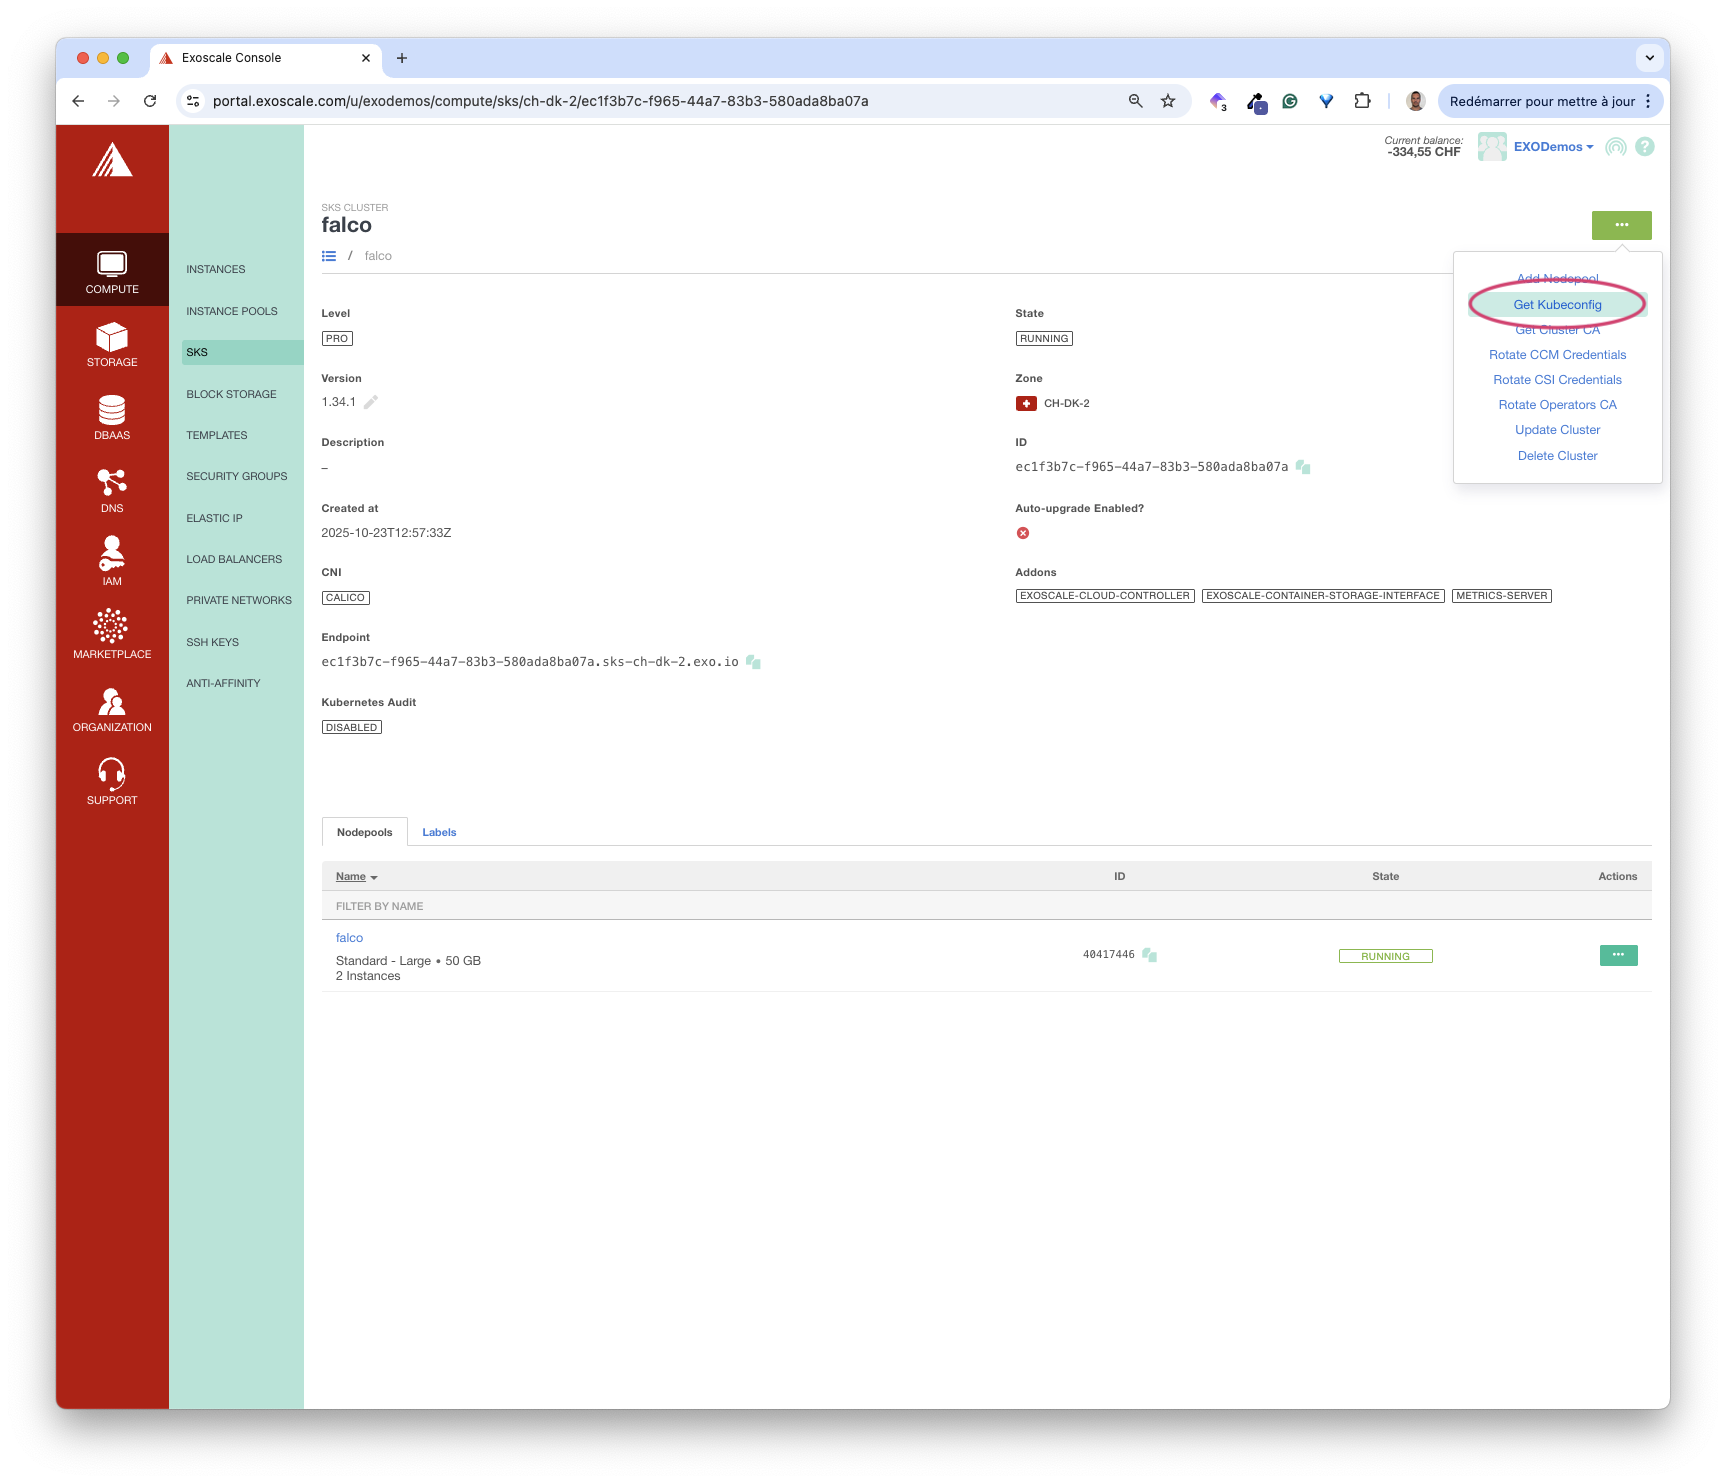
Then, we can get a Kubeconfig file to configure our local kubectl.
In the next section, we’ll install Falco and the components we need to secure the webhook endpoint.
Installing Traefik Ingress Controller
First, we need an Ingress Controller to expose the Falco Service (which we will create in the next step). We install Traefik with Helm using the values file below. This file configures Traefik to use a JWT authentication plugin (more on that in a bit).
experimental:
  plugins:
    jwt:
      moduleName: github.com/traefik-plugins/traefik-jwt-plugin
      version: v0.7.1
helm upgrade --install traefik traefik/traefik \
--namespace traefik \
--create-namespace \
--version 37.1.2 \
--values ./values-traefik.yamlCreating A DNS record
As we’ll expose the Falco Service on the subdomain falco.exoscale.dev, we need to associate this subdomain with the external IP address of the LoadBalancer Service created with Traefik.
First, we get this IP address.
kubectl -n traefik get svc traefik -o jsonpath='{.status.loadBalancer.ingress[0].ip}')
194.182.162.94
Next, we associate it with the subdomain.
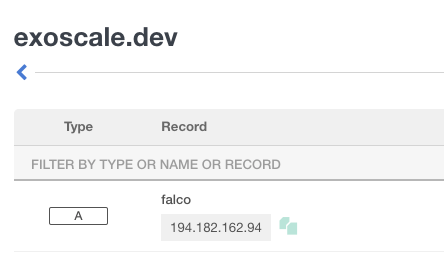
Then we verify that the resolution is correct.
$ dig falco.exoscale.dev

; <<>> DiG 9.10.6 <<>> falco.exoscale.dev
;; global options: +cmd
;; Got answer:
;; ->>HEADER<<- opcode: QUERY, status: NOERROR, id: 22442
;; flags: qr rd ra; QUERY: 1, ANSWER: 1, AUTHORITY: 0, ADDITIONAL: 1

;; OPT PSEUDOSECTION:
; EDNS: version: 0, flags:; udp: 512
;; QUESTION SECTION:
;falco.exoscale.dev.            IN      A

;; ANSWER SECTION:
falco.exoscale.dev.     3600    IN      A       194.182.162.94     <- Resolution is OK!

;; Query time: 28 msec
;; SERVER: 8.8.8.8#53(8.8.8.8)
;; WHEN: Tue Oct 14 14:55:07 CEST 2025
;; MSG SIZE  rcvd: 63
Installing Cert-Manager
To secure the webhook endpoint, we use Cert-Manager, a widely used tool that generates TLS certificates.
First, we install Cert-manager using Helm.
helm install cert-manager jetstack/cert-manager \
--namespace cert-manager \
--create-namespace \
--version v1.19.0 \
--set crds.enabled=true
Next, we create a clusterIssuer CRD. This resource specifies the Certificate Authority responsible for signing the certificate, Let’s Encrypt in this example.
apiVersion: cert-manager.io/v1
kind: ClusterIssuer
metadata:
  name: letsencrypt
spec:
  acme:
    server: https://acme-v02.api.letsencrypt.org/directory
    email: luc@techwhale.io
    privateKeySecretRef:
      name: letsencrypt-key
    solvers:
      - http01:
          ingress:
            class: traefik
kubectl apply -f clusterIssuer.yamlInstalling Falco
We are now ready to install Falco from its Helm Chart. We use the following values file, which configures falco as a webhook receiver using the k8s-audit plugin and enables falcosidekick, a web interface for visualizing events.
driver:
  enabled: false

controller:
  kind: deployment
  deployment:
    replicas: 1

resources:
  requests:
    cpu: 2000m
    memory: 2048Mi
  limits:
    cpu: 2000m
    memory: 2048Mi

falcoctl:
  artifact:
    install:
      enabled: true
    follow:
      enabled: true
  config:
    artifact:
      install:
        refs: [k8saudit-rules:latest, k8saudit:latest, json:latest]
      follow:
        refs: [k8saudit-rules:latest]

services:
  - name: k8saudit-webhook
    type: ClusterIP
    ports:
      - port: 9765
        protocol: TCP

falco:
  rules_files:
    - /etc/falco/k8s_audit_rules.yaml
    - /etc/falco/rules.d
  plugins:
    - name: k8saudit
      library_path: libk8saudit.so
      init_config: ""
      open_params: "http://:9765/k8s-audit"
    - name: json
      library_path: libjson.so
      init_config: ""
  load_plugins:
    - k8saudit
    - json

falcosidekick:
  enabled: true
  replicaCount: 1
  webui:
    enabled: true
    replicaCount: 1
    redis:
      storageSize: "5Gi"
      storageClass: "exoscale-sbs"
helm upgrade --install falco falcosecurity/falco --namespace falco --create-namespace --values values.yaml --version 6.4.0By default, the k8saudit plugin uses this list of rules.
Let’s consider one of these rules as an example.
- rule: Pod Created in Kube Namespace
  desc: Detect any attempt to create a pod in the kube-system or kube-public namespaces
  condition: kevt and pod and kcreate and ka.target.namespace in (kube-system, kube-public) and not allowed_kube_namespace_pods
  output: Pod created in kube namespace (user=%ka.user.name pod=%ka.resp.name resource=%ka.target.resource ns=%ka.target.namespace images=%ka.req.pod.containers.image)
  priority: WARNING
  source: k8s_audit
  tags: [k8s]
This rule raises a Warning when we create a Pod in the Namespaces kube-system or kube-public, which we usually use for internal processes/applications. We’ll test this rule later in this article.
Securing the endpoint
Now that the Falco is running, we’ll expose its webhook endpoint over TLS and require a Bearer token for authentication.
TLS Certificate
We create a Certificate for the subdomain.
apiVersion: cert-manager.io/v1
kind: Certificate
metadata:
  name: falco-tls
  namespace: falco
spec:
  secretName: falco-tls
  dnsNames:
    - falco.exoscale.dev
  issuerRef:
    name: letsencrypt
    kind: ClusterIssuer
kubectl apply -f certificate.yamlCert-manager is the component that handles the creation of a TLS certificate for the falco.exoscale.dev subdomain from the Certificate resource.
Authentication token
Since Falco does not have any authentication mechanism, we’ll use Traefik’s JWT plugin to add one.
First, we create a PKI key pair.
openssl genrsa -out falco-private.pem 2048
openssl rsa -in falco-private.pem -pubout -out falco-public.pem
Next, we use a simple Python script to generate a signed JWT with the private key created above.
import jwt
import time
# Read private key
with open("falco-private.pem", "r") as f:
private_key = f.read()
payload = {
"iss": "k8s-apiserver",
"aud": "falco",
"sub": "audit-webhook",
"exp": int(time.time()) + 15552000
}
token = jwt.encode(payload, private_key, algorithm="RS256")
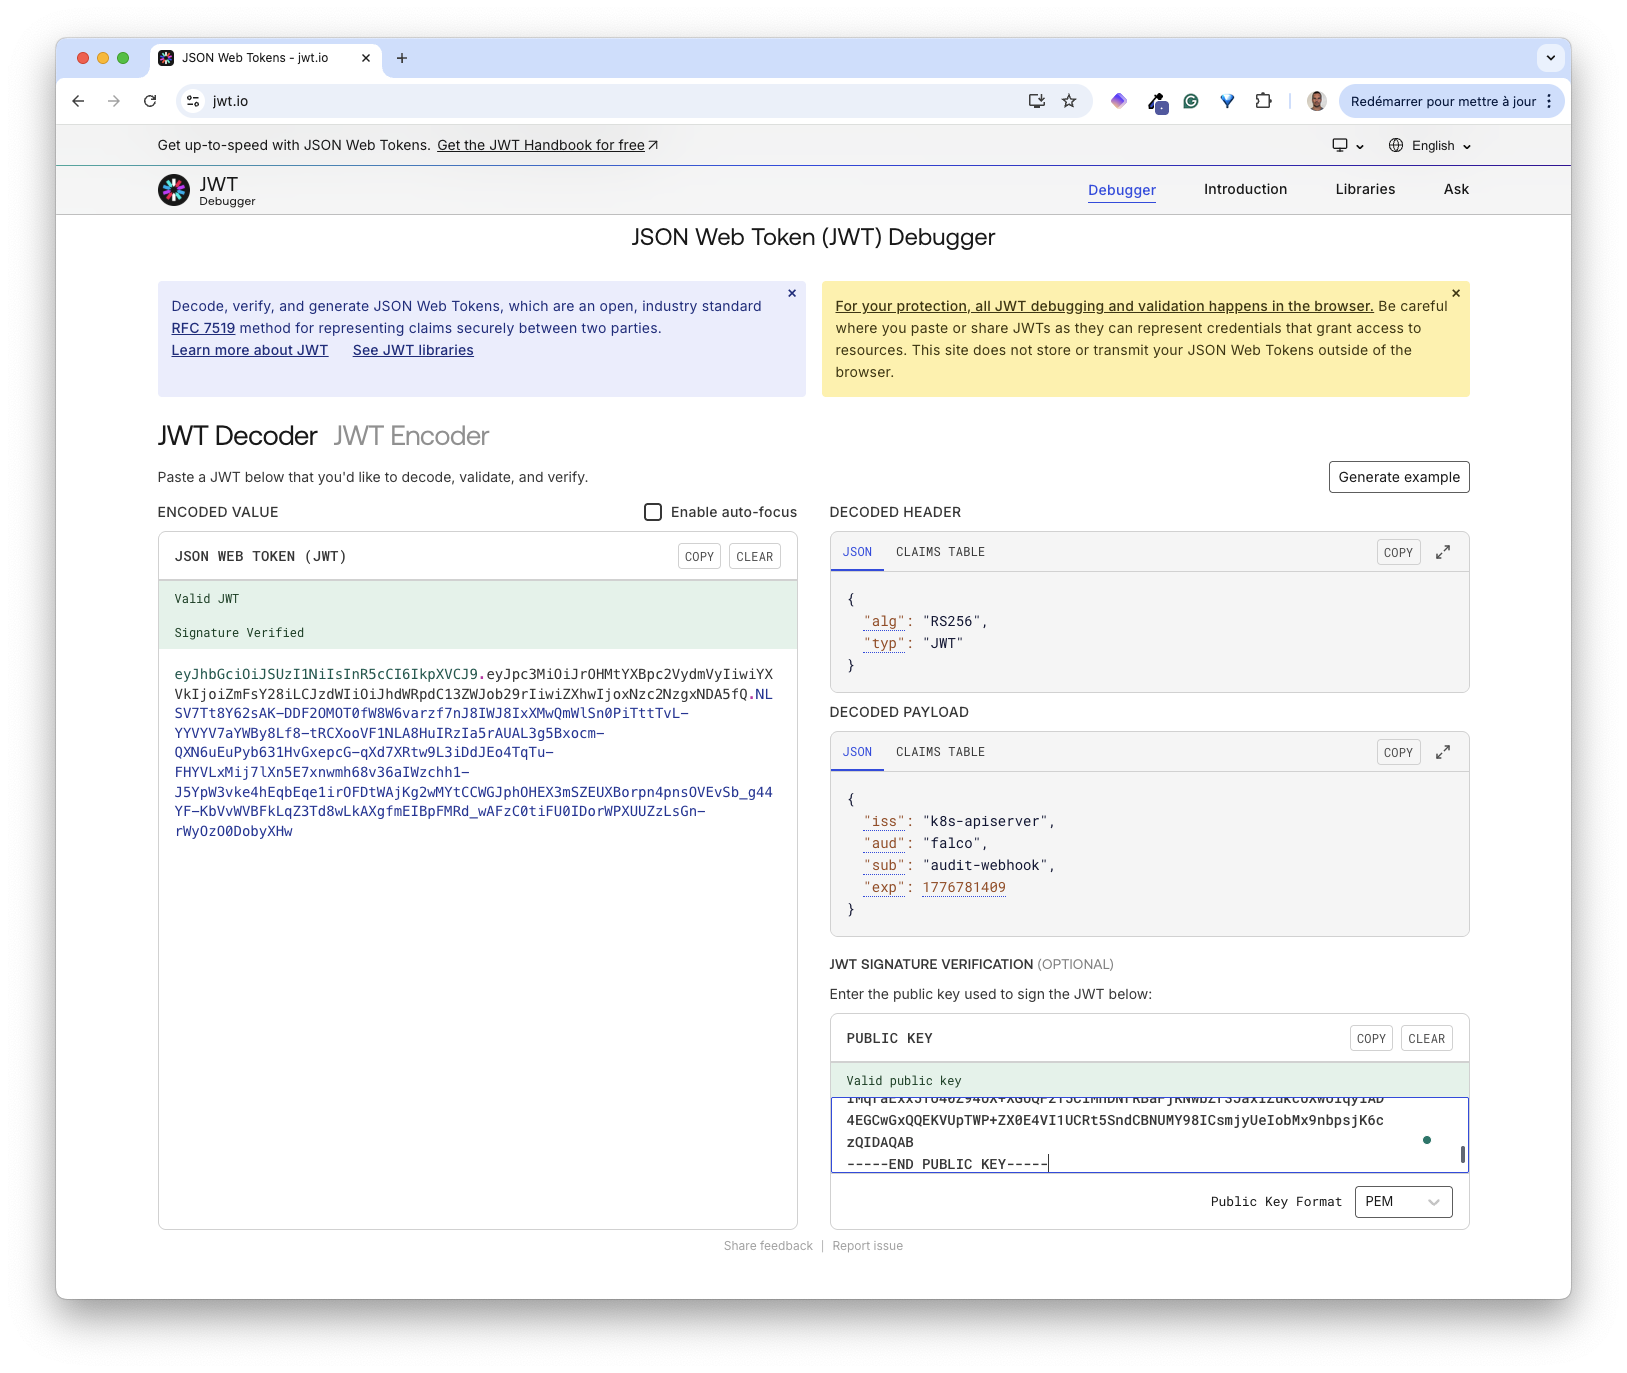
print(token)This script returns a JWT similar to the one below.
$ python keys.py

eyJhbGciOiJSUzI1NiIsInR5cCI6IkpXVCJ9.eyJpc3MiOiJrOHMtYXBpc2VydmVyIiwiYXVkIjoiZmFsY28iLCJzdWIiOiJhdWRpdC13ZWJob29rIiwiZXhwIjoxNzc2NzgxNDA5fQ.NLSV7Tt8Y62sAK-DDF2OMOT0fW8W6varzf7nJ8IWJ8IxXMwQmWlSn0PiTttTvL-YYVYV7aYWBy8Lf8-tRCXooVF1NLA8HuIRzIa5rAUAL3g5Bxocm-QXN6uEuPyb631HvGxepcG-qXd7XRtw9L3iDdJEo4TqTu-FHYVLxMij7lXn5E7xnwmh68v36aIWzchh1-J5YpW3vke4hEqbEqe1irOFDtWAjKg2wMYtCCWGJphOHEX3mSZEUXBorpn4pnsOVEvSb_g44YF-KbVvWVBFkLqZ3Td8wLkAXgfmEIBpFMRd_wAFzC0tiFU0IDorWPXUUZzLsGn-rWyOzO0DobyXHw
We can view the content of this JWT from jwt.io
Traefik Middleware & IngressRoute
We can now expose the Falco webhook endpoint using Traefik.
First, we create a Middleware resource (one of Traefik’s CRDs) that verifies the authentication token.
apiVersion: traefik.io/v1alpha1
kind: Middleware
metadata:
  name: falco-jwt-auth
  namespace: falco
spec:
  plugin:
    jwt:
      Alg: "RS256"
      PayloadFields:
        - iss
        - aud
        - sub
        - exp
      Required: true
      Keys: |
        -----BEGIN PUBLIC KEY-----
        MIIBIjANBgkqhkiG9w0BAQEFAAOCAQ8AMIIBCgKCAQEAyBhFOmOPoJjZkfYmELCv
        mdvbWwhXApAjkAtgAdIqbiwvQ8vrg0h1PLlwJt64u6iE+JNNhek2iBwGt2A9ul3n
        n+OrR3/fm88u4wJnjv8zAHoxHO2fMQFc6f6W8q+c+4/xZ93O4gfIbXjAhV5XnS8X
        ToIEBp4PMHafarcvuyGYJ8SODLqOuTRdUlCWBEHVWOiwlcuuGTAun2gBuOiDJ974
        IMqraExx5To40Z94UX+XGUQF2T5CiMhDNrRBaFjKNwbZr3JaxIZukcUXwoiqyiAD
        4EGCwGxQQEKVUpTWP+ZX0E4VI1UCRt5SndCBNUMY98ICsmjyUeIobMx9nbpsjK6c
        zQIDAQAB
        -----END PUBLIC KEY-----
      JwtSources:
        - type: bearer
          key: Authorization
kubectl apply -f middleware.yamlNext, we create an IngressRoute in Traefik. This one uses the Middleware created above and ensures each request to the webhook contains a Bearer token in the Authorization header.
apiVersion: traefik.io/v1alpha1
kind: IngressRoute
metadata:
  name: falco-webhook
  namespace: falco
spec:
  entryPoints:
    - websecure
  routes:
    - match: Host(`falco.exoscale.dev`)
      kind: Rule
      services:
        - name: falco-k8saudit-webhook
          port: 9765
      middlewares:
        - name: falco-jwt-auth
  tls:
    secretName: falco-tls
kubectl apply -f ingressRoute.yamlWe can now test the endpoint by sending an empty event.
{
  "kind": "EventList",
  "apiVersion": "audit.k8s.io/v1",
  "metadata": {},
  "items": []
}
$ curl -i -XPOST \
-d @empty-event.json \
-H "Content-Type: application/json" \
-H "Authorization: bearer $JWT" \
"https://falco.exoscale.dev/k8s-audit"
HTTP/2 200
date: Thu, 23 Oct 2025 14:33:12 GMT
content-length: 0The HTTP status code 200 indicates falco has received the event. The cluster responsible for monitoring audit logs is now ready. Let’s now configure an SKS cluster to ship its audit logs.
Enabling the audit logs
In this part, we’ll consider an existing SKS cluster and enable the Kubernetes Audit option as follows:
Endpointtargets the webhook exposed by Falco’s k8s-audit pluginBearer tokenis the JWT we generated earlierInitial backoffdefaults to 10s
After updating the cluster’s configuration with these values, the audit logs are automatically sent in batches to the falco cluster. We can verify this by checking Falco’s Pod logs.
First, we retrieve the Pod name.
$ kubectl -n falco get po
NAME                                     READY   STATUS    RESTARTS   AGE
falco-685fdb49d4-x9z5q                   2/2     Running   0          9d
falco-falcosidekick-54dc9b5f47-d2st8     1/1     Running   0          9d
falco-falcosidekick-ui-db4654d9d-j92qz   1/1     Running   0          9d
falco-falcosidekick-ui-redis-0           1/1     Running   0          9d
Next, we check its logs.
$ kubectl -n falco logs falco-685fdb49d4-x9z5q
...
{"hostname":"pool-93294-wfgvn","output":"17:06:01.792752000: Warning K8s Operation performed by user not in allowed list of users (user=ccm-a86ec16c-32e6-4ea6-af37-3a4d4ec92de1 target=cloud-controller-manager/leases verb=update uri=/apis/coordination.k8s.io/v1/namespaces/kube-system/leases/cloud-controller-manager?timeout=10s resp=200)","output_fields":{"evt.time":1761239161792752000,"ka.response.code":"200","ka.target.name":"cloud-controller-manager","ka.target.resource":"leases","ka.uri":"/apis/coordination.k8s.io/v1/namespaces/kube-system/leases/cloud-controller-manager?timeout=10s","ka.user.name":"ccm-a86ec16c-32e6-4ea6-af37-3a4d4ec92de1","ka.verb":"update"},"priority":"Warning","rule":"Disallowed K8s User","source":"k8s_audit","tags":["k8s"],"time":"2025-10-23T17:06:01.792752000Z"}
{"hostname":"pool-93294-wfgvn","output":"17:06:04.505879000: Warning K8s Operation performed by user not in allowed list of users (user=ccm-a86ec16c-32e6-4ea6-af37-3a4d4ec92de1 target=cloud-controller-manager/leases verb=get uri=/apis/coordination.k8s.io/v1/namespaces/kube-system/leases/cloud-controller-manager?timeout=10s resp=200)","output_fields":{"evt.time":1761239164505879000,"ka.response.code":"200","ka.target.name":"cloud-controller-manager","ka.target.resource":"leases","ka.uri":"/apis/coordination.k8s.io/v1/namespaces/kube-system/leases/cloud-controller-manager?timeout=10s","ka.user.name":"ccm-a86ec16c-32e6-4ea6-af37-3a4d4ec92de1","ka.verb":"get"},"priority":"Warning","rule":"Disallowed K8s User","source":"k8s_audit","tags":["k8s"],"time":"2025-10-23T17:06:04.505879000Z"}
Those logs come from internal components that communicate with the API Server. Falco generates these events because of a rule that raises a Warning if an element not in the allowlist sends a request to the API Server. This rule is defined in this list of rules:
- rule: Disallowed K8s User
  desc: Detect any k8s operation by users outside of an allowed set of users.
  condition: kevt and non_system_user and not ka.user.name in (allowed_k8s_users) and not ka.user.name in (eks_allowed_k8s_users)
  output: K8s Operation performed by user not in allowed list of users (user=%ka.user.name target=%ka.target.name/%ka.target.resource verb=%ka.verb uri=%ka.uri resp=%ka.response.code)
  priority: WARNING
  source: k8s_audit
  tags: [k8s]
The CCM (Cloud Controller Manager) is a component deployed by Exoscale in SKS. It allows the cluster’s control plane to communicate with Exoscale infrastructure. For example, the CCM is used to create a Load Balancer on Exoscale when we create a LoadBalancer Service in SKS. The CCM needs to communicate with the API Server so we can safely ignore these Warnings.
Let’s now generate an event to trigger the rule we presented in a previous section.
- rule: Pod Created in Kube Namespace
  desc: Detect any attempt to create a pod in the kube-system or kube-public namespaces
  condition: kevt and pod and kcreate and ka.target.namespace in (kube-system, kube-public) and not allowed_kube_namespace_pods
  output: Pod created in kube namespace (user=%ka.user.name pod=%ka.resp.name resource=%ka.target.resource ns=%ka.target.namespace images=%ka.req.pod.containers.image)
  priority: WARNING
  source: k8s_audit
  tags: [k8s]
For this purpose, we run a Pod in the kube-system Namespace as follows.
kubectl run my-demo-pod -n kube-system --image=nginxAfter a few seconds, we get the following message in Falco’s log.
{
  "hostname": "pool-93294-wfgvn",
  "output": "17:21:13.745034000: Warning Pod created in kube namespace (user=kubernetes-admin pod=my-demo-pod resource=pods ns=kube-system images=(nginx))",
  "output_fields": {
    "evt.time": 1761240073745034000,
    "ka.req.pod.containers.image": [
      "nginx"
 ],
    "ka.resp.name": "my-demo-pod",
    "ka.target.namespace": "kube-system",
    "ka.target.resource": "pods",
    "ka.user.name": "kubernetes-admin"
 },
  "priority": "Warning",
  "rule": "Pod Created in Kube Namespace",
  "source": "k8s_audit",
  "tags": [
    "k8s"
 ],
  "time": "2025-10-23T17:21:13.745034000Z"
}
This event shows the whole chain in action:
- We create a Pod in the kube-system namespace
- This creation generates an audit log sent to Falco
- The audit log matches one of Falco’s rules
- Falco raises a Warning that we can see in its logs
When we installed Falco with Helm, we enabled falcosidekick. This component provides a nice UI for visualizing the rules triggered by the cluster’s events. For example, trying to run a shell in a Pod results in a Notice, as shown below.
kubectl -n kube-system exec -ti my-demo-pod -- sh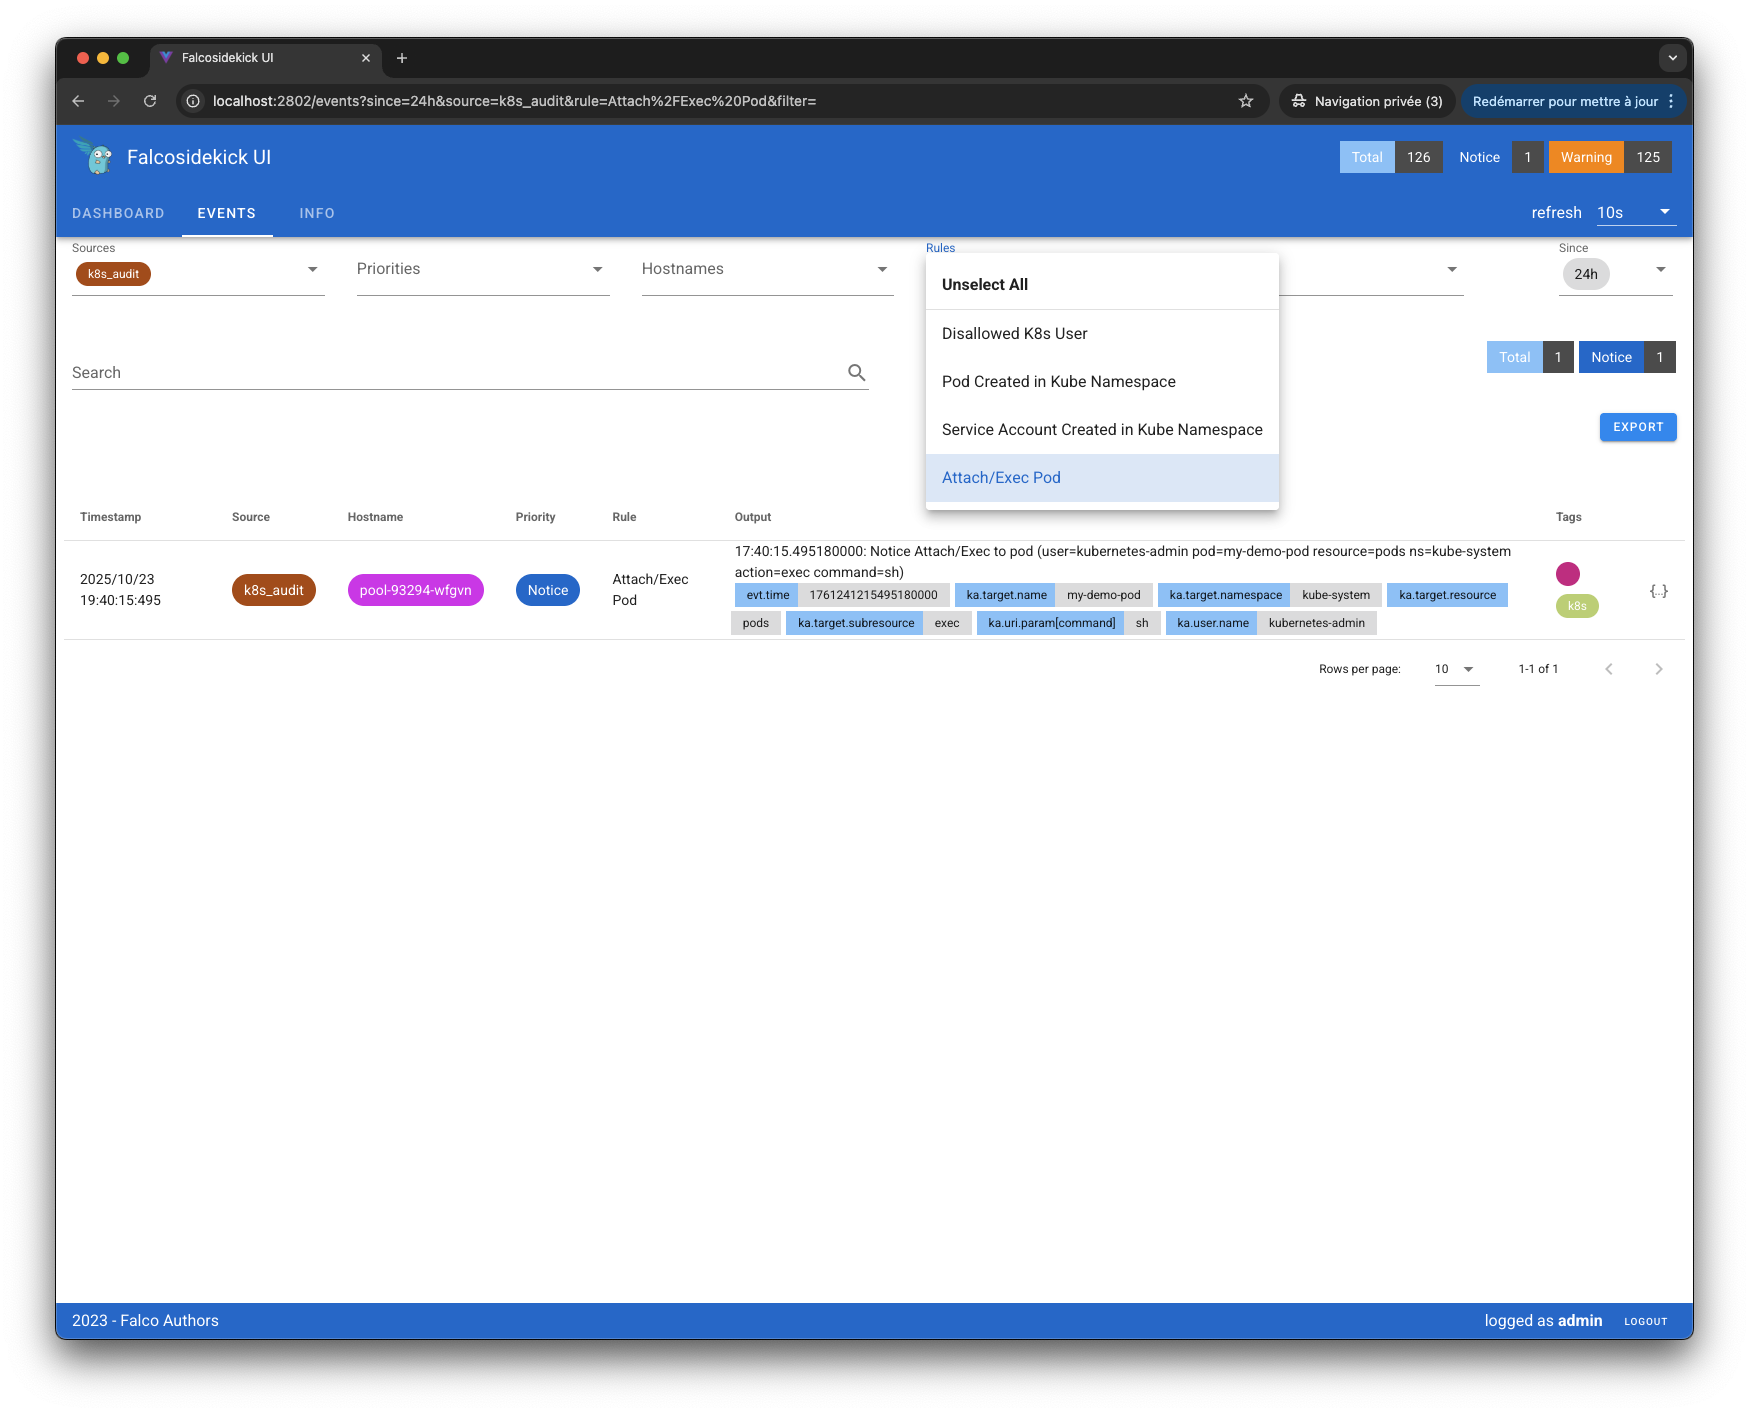
Key takeaways
Kubernetes audit logs are essential for detecting suspicious activities as they happen and provide detailed forensic data for security investigations. In this article, we detailed the setup of a secure Falco-based webhook, with Falco being the de facto standard for Kubernetes security monitoring. The webhook flexibility that Exoscale provides allows you to send audit logs to any webhook endpoint, giving you complete control over your audit data and tooling choices.

